


- Trending
- Comments
- Latest

Ethereum price is showing early signs of recovery as Spot ETH ETFs inflow resumes in the U.S. recording $141 million in net inflows and signaling renewed investor confidence after several days of outflows.
Ethereum is trading at $3,857, down 0.2% in the past 24 hours. Over the last week, the token fluctuated between $3,709 and $4,183 leading to a 10% drop over the past 30 days and a 6% weekly loss. Despite this decline, Ethereum remains 21% below its August peak of $4,946.
Market activity is rebounding in tandem with the Spot ETH ETFs inflow trend. Ethereum’s 24 hour trading volume surged 35.2% to $45.8 billion while derivatives volume climbed 57.3% to $114.2 billion according to CoinGlass data. Open interest also rose 0.6% to $43.8 billion reflecting traders’ growing willingness to rebuild positions after last week’s correction.
After three straight days of redemptions, Spot ETH ETFs inflow in the U.S. turned positive on Oct. 21, totaling $141.6 million data from SoSoValue shows. Fidelity’s FETH led the pack with $59.07 million followed by BlackRock’s ETHA at $42.46 million.
Grayscale’s Mini ETH and ETHE added to the bullish momentum, with inflows of $22.58 million and $13.14 million respectively. Notably, no funds reported outflows for the day a sign that Spot ETH ETFs inflow could be regaining traction.
Analysts suggest that the sustained Spot ETH ETFs inflow could strengthen Ethereum’s short term price action if momentum continues through late October. The timing aligns with growing expectations ahead of the FOMC rate decision (Oct. 28–29) where markets are pricing in a 95% probability of a 25 bps rate cut.
If the Federal Reserve signals a dovish stance risky assets like cryptocurrencies could benefit from improved liquidity, further boosting Spot ETH ETFs inflow and price momentum. Conversely, a hawkish tone might limit the recovery.
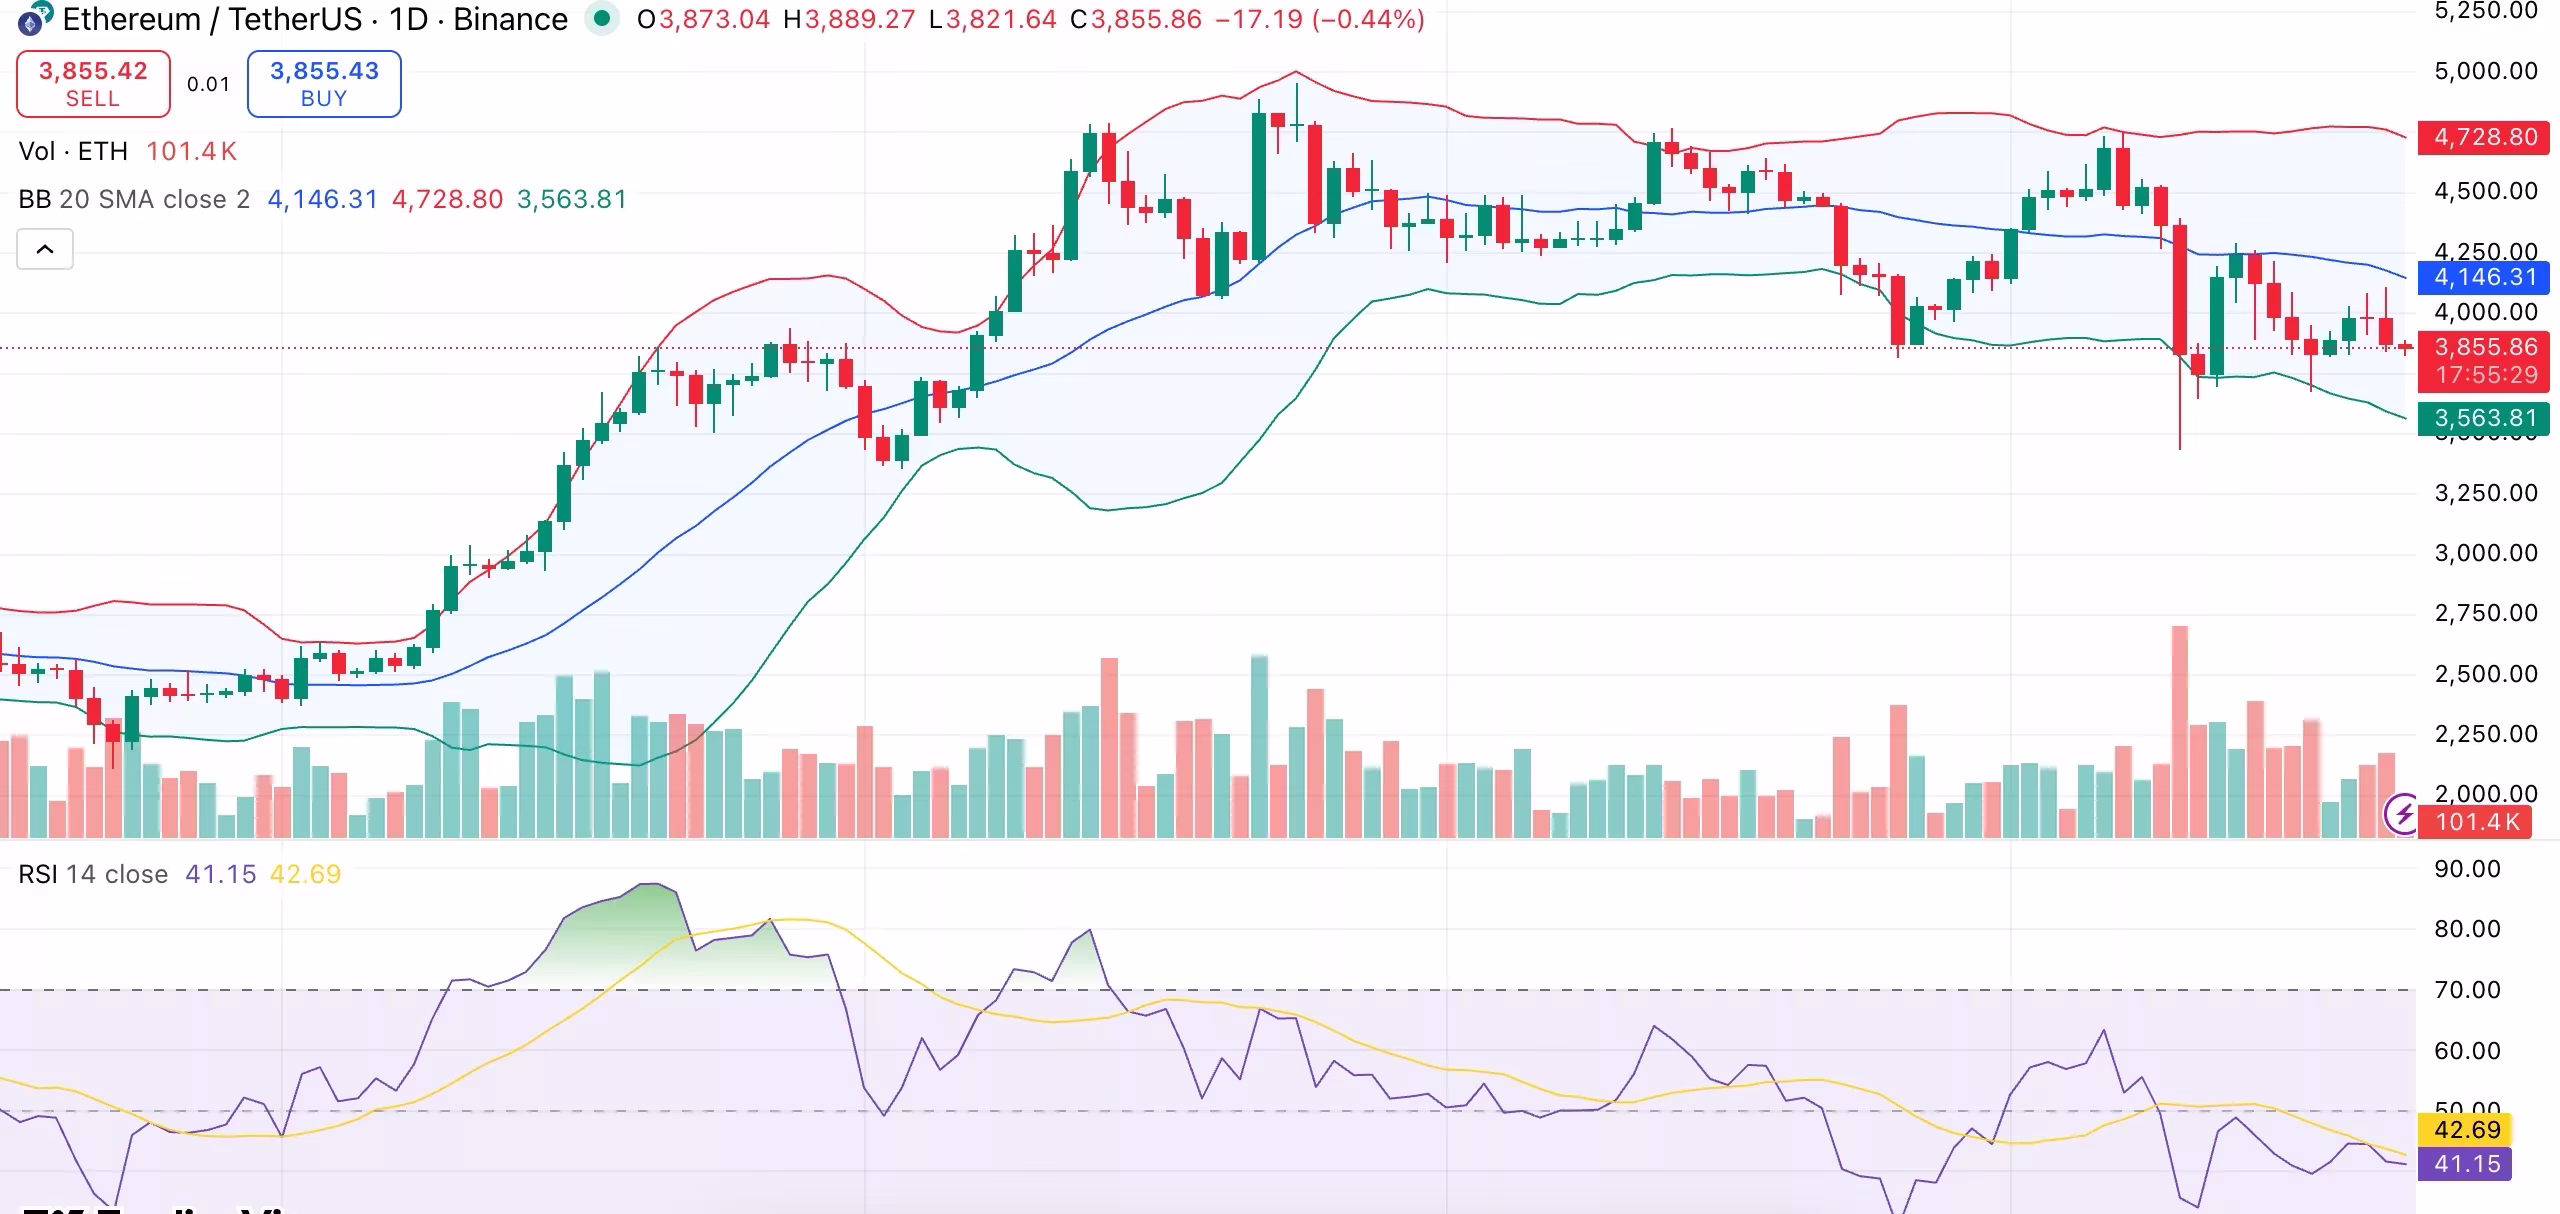
From a technical perspective, Ethereum remains below the Bollinger Band midline at $4,146 with resistance around $4,720 and support near $3,563. The narrowing bands indicate price compression often a precursor to a strong directional breakout.
The relative strength index (RSI) sits at 41.15, showing mild bearish momentum but no oversold condition. A rebound above the 45–50 RSI range could confirm a short-term recovery, supported by consistent Spot ETH ETFs inflow.
Most short term moving averages, including the 10-day, 20-day,50-day, and 100-day EMAs flash sell signals suggesting a fragile trend. However, the 200-day EMA at $3,570 still points to a long term uptrend aligning with ongoing Spot ETH ETFs inflow activity.
If Spot ETH ETFs inflow continues at its current pace and the Fed confirms a rate cut, Ethereum could climb above $3,900 and retest the $4,350–$4,500 resistance range. Should inflows slow or macro sentiment weaken, the token may slip below $3,800 targeting support at $3,560 or even $3,400.
Overall, the renewed Spot ETH ETFs inflow offers a potential catalyst for Ethereum’s next move helping restore market confidence after weeks of volatility.

Copyright © 2025 - The Bit Gazette.

