


- Trending
- Comments
- Latest
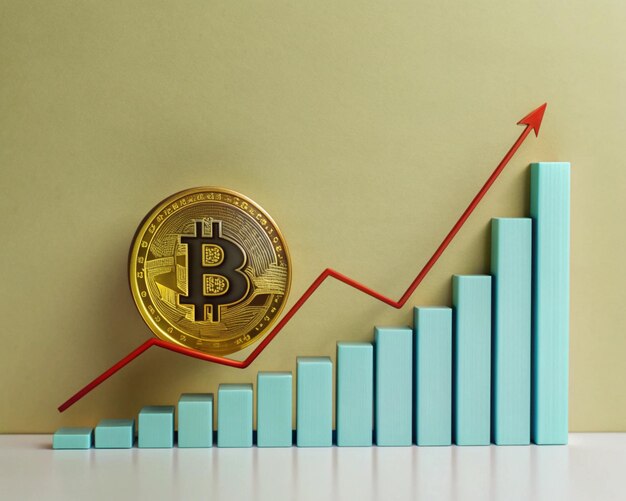
The Bitcoin 3-year chart pattern is nearing a critical breakout point, sparking excitement among investors and analysts alike. According to Gert van Lagen, an independent technical analyst, the current price action for BTC will have an explosive outcome, leading to a parabolic rise and a price target of $260,000 by the end of 2024.
Van Lagen highlights the formation of a parabolic curve, where BTC has continued to rise in a step-like formation. This pattern, which has taken shape over almost three years, dating back to October 2021, is a rare Cup-and-Handle (CnH) pattern on the weekly chart.
The success rate of a CnH pattern is a staggering 95%, according to Tom Bulkowski, a well-known trader and creator of (link unavailable) This pattern confirms a trend bottom and then a higher sideways consolidation during its development, setting the stage for a parabolic rise.
Van Lagen expects “the steepest kind of ascent BTC has ever witnessed” or a blow-off-top rally once Bitcoin breaches above Base 4, the final phase of the parabolic curve. This breakout will trigger a massive price surge, with a target of $260,000 by the end of 2024, representing a 312% gain from BTC’s current prices.
successful breakout from a CnH pattern can trigger a parabolic rise since the pattern confirms a trend bottom and then a higher sideways consolidation during its development.
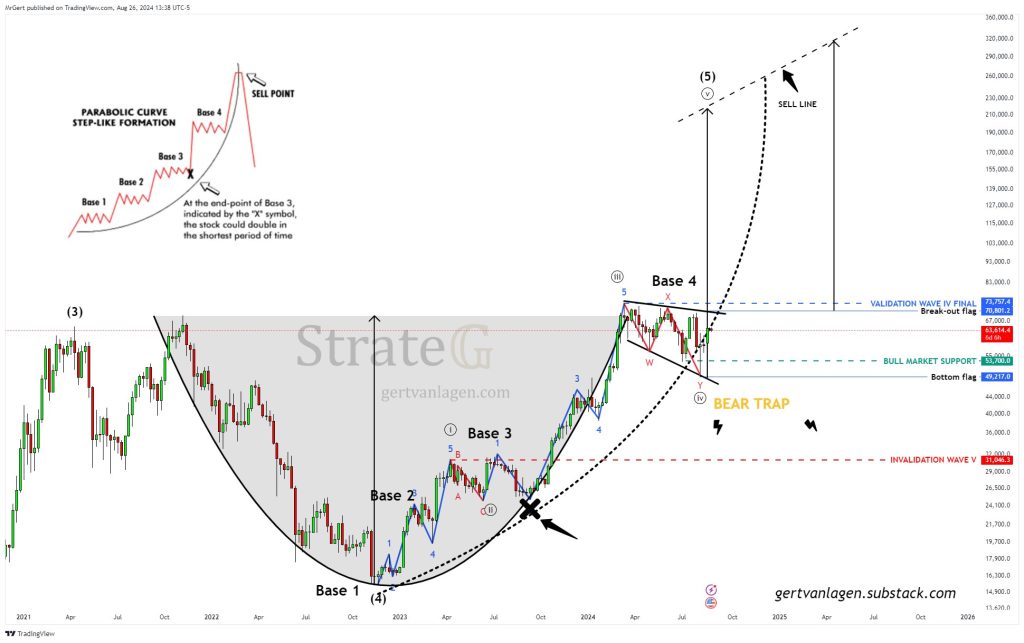
In the parabolic curve, Base 1 was formed at the market bottom in November 2022. A recovery from the market bottom at $15,460 to $25,290 confirmed Base 2. Bitcoin’s sideways consolidation between $30,000 and $25,000 during April 2023 and September 2023 led to Base 3.
Moving forward, Bitcoin witnessed its first parabolic rise of 198%, reaching a new all-time high of $73,737 in March 2024.
As Bitcoin approaches its previous all-time high range, a large liquidation event is expected to occur. Data from Coinglass suggests that short liquidations amount to $7.18 billion at $70,493, with another $6.54 billion in short positions to be liquidated at $72,581.
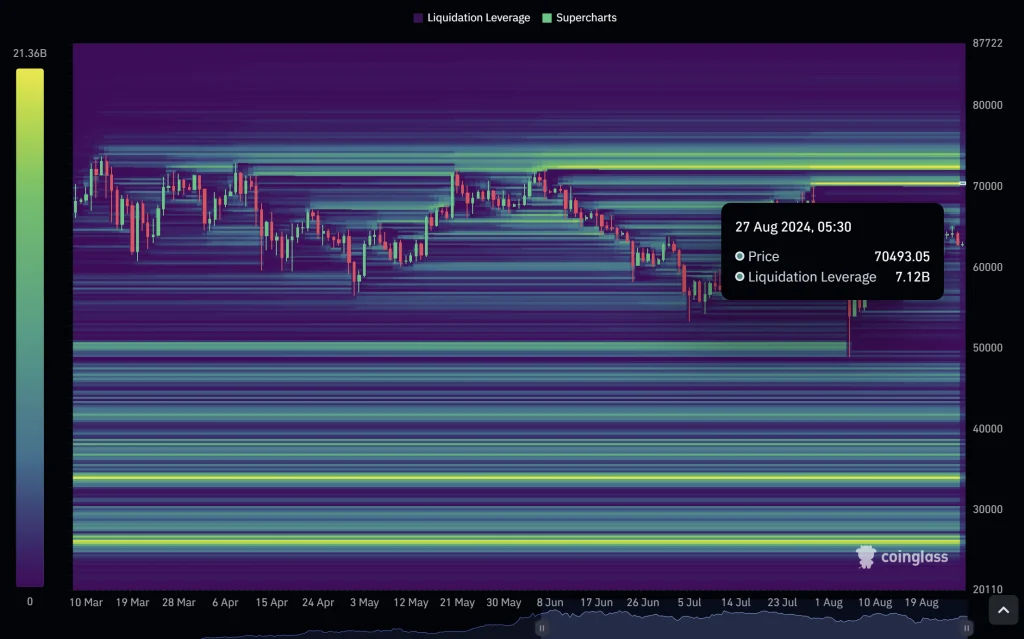
Bitcoin price, crossing above its previous all-time high range at over $70,000, will not be without a few consequences for futures traders. Data from Coinglass suggests a large liquidation event will occur once BTC crosses $70,493.
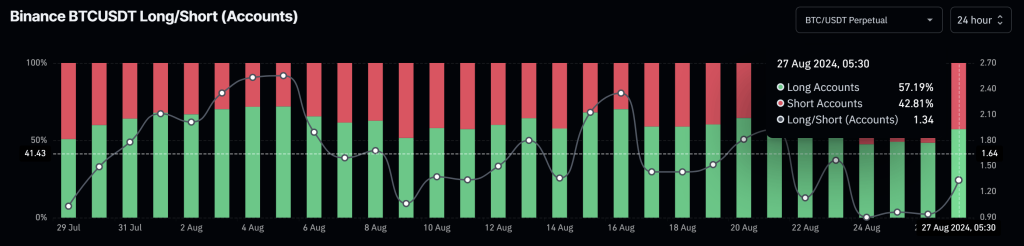
The data indicates that 57.19% of the accounts are currently long. Yet, the taker buy/sell volume between long and short traders was closely matched, as the Longs/Short ratio remained at 1.01
Cointelegraph reported a similar prediction for Bitcoin by another analyst, who expects BTC to reach as high as $150,000 by the end of 2024. Jame Coutts, Real Vision analyst, touts a familiar tone where he expected BTC price action to enter “batshit season” or the Banana zone, a parabolic rally where price and volume witness a significant escalation.
Additionally, Smithson With, a Bitcoin researcher, also shared a study that correctly called Bitcoin’s peak from previous bull cycles. With’s price targets varied over the course of 2025, but the minimum expected price is $164,173 by Jan. 1, 2025.
Overall, these predictions follow a similar pattern where BTC is expected to move rapidly once its previous all-time high is breached.
In Conclusion, the Bitcoin 3-year chart pattern is nearing a critical breakout point, with analysts expecting a 312% ROI to $260,000 by the end of 2024. The parabolic curve and Cup-and-Handle pattern are unfolding, indicating a potential parabolic rise. With a 95% success rate, the Cup-and-Handle pattern suggests a trend bottom and higher sideways consolidation. As Bitcoin approaches its previous all-time high, a large liquidation event is expected, with over $7 billion in shorts to be liquidated. The Bitcoin market is poised for a significant price move, and investors are eagerly awaiting the next bull run.
The Bitcoin 3-year chart pattern is a compelling indication of a potential price surge. With analysts predicting a 312% ROI to $260,000, investors should be prepared for a significant market movement. As the parabolic curve and Cup-and-Handle pattern continue to unfold, it’s essential to stay informed and up-to-date on the latest market developments.

Copyright © 2025 - The Bit Gazette.
