


- Trending
- Comments
- Latest

The U.S. Bureau of Labor Statistics reported that July’s Consumer Price Index (CPI) inflation rate has dropped to 2.9%, falling below the anticipated 3% and marking a significant economic milestone. This is the first time in 39 months that the U.S. CPI inflation data has show a dip below 3%, signaling a cooling trend in inflation. The decline also represents the fourth consecutive month of decreasing CPI inflation, pointing to a potential shift in the broader financial landscape. July’s dip, from 3.0% in June and 3.3% in May, suggests that inflationary pressures are easing, offering cautious optimism for consumers and investors alike.
Recently, Bitcoin surged to $61,809 following the release of July’s CPI inflation data by the U.S. Bureau of Labor Statistics (BLS). The report revealed that inflation had cooled to 2.9%, down from June’s figures, which was widely perceived as a positive sign for both traditional and digital markets. Investors initially reacted optimistically, propelling BTC close to $62,000. Bitcoin Funding Rate. Source: Santiment
However, this rally was short-lived. The price quickly reversed, falling below the $60,000 threshold, leaving traders and analysts puzzled. The CPI inflation data, which typically boosts market confidence, failed to sustain Bitcoin’s upward momentum, leading to what has now been termed a “fakeout.”
A “fakeout” in trading occurs when an asset’s price moves significantly in one direction, creating the illusion of a strong trend, only to abruptly reverse course. In Bitcoin’s case, the initial spike was deceiving, as the market’s enthusiasm waned just as quickly as it appeared.
As Bitcoin’s price plunged below $60,000, it became clear that this level had transformed into a significant resistance point. Resistance levels are price points where an asset struggles to break through due to selling pressure. For Bitcoin, $60,000 now stands as a psychological barrier, challenging its ability to maintain gains.
At the time of writing, Bitcoin is trading at $58,069, representing an 8% drop in the past 24 hours. The swift decline has led to a reduction in profitable daily transactions. Analysis of the coin’s daily transaction volume reveals that traders are recording more losses than gains. The ratio of daily transactions in profit to those in loss currently sits at 0.88, indicating that for every profitable transaction, there are more that end in loss.
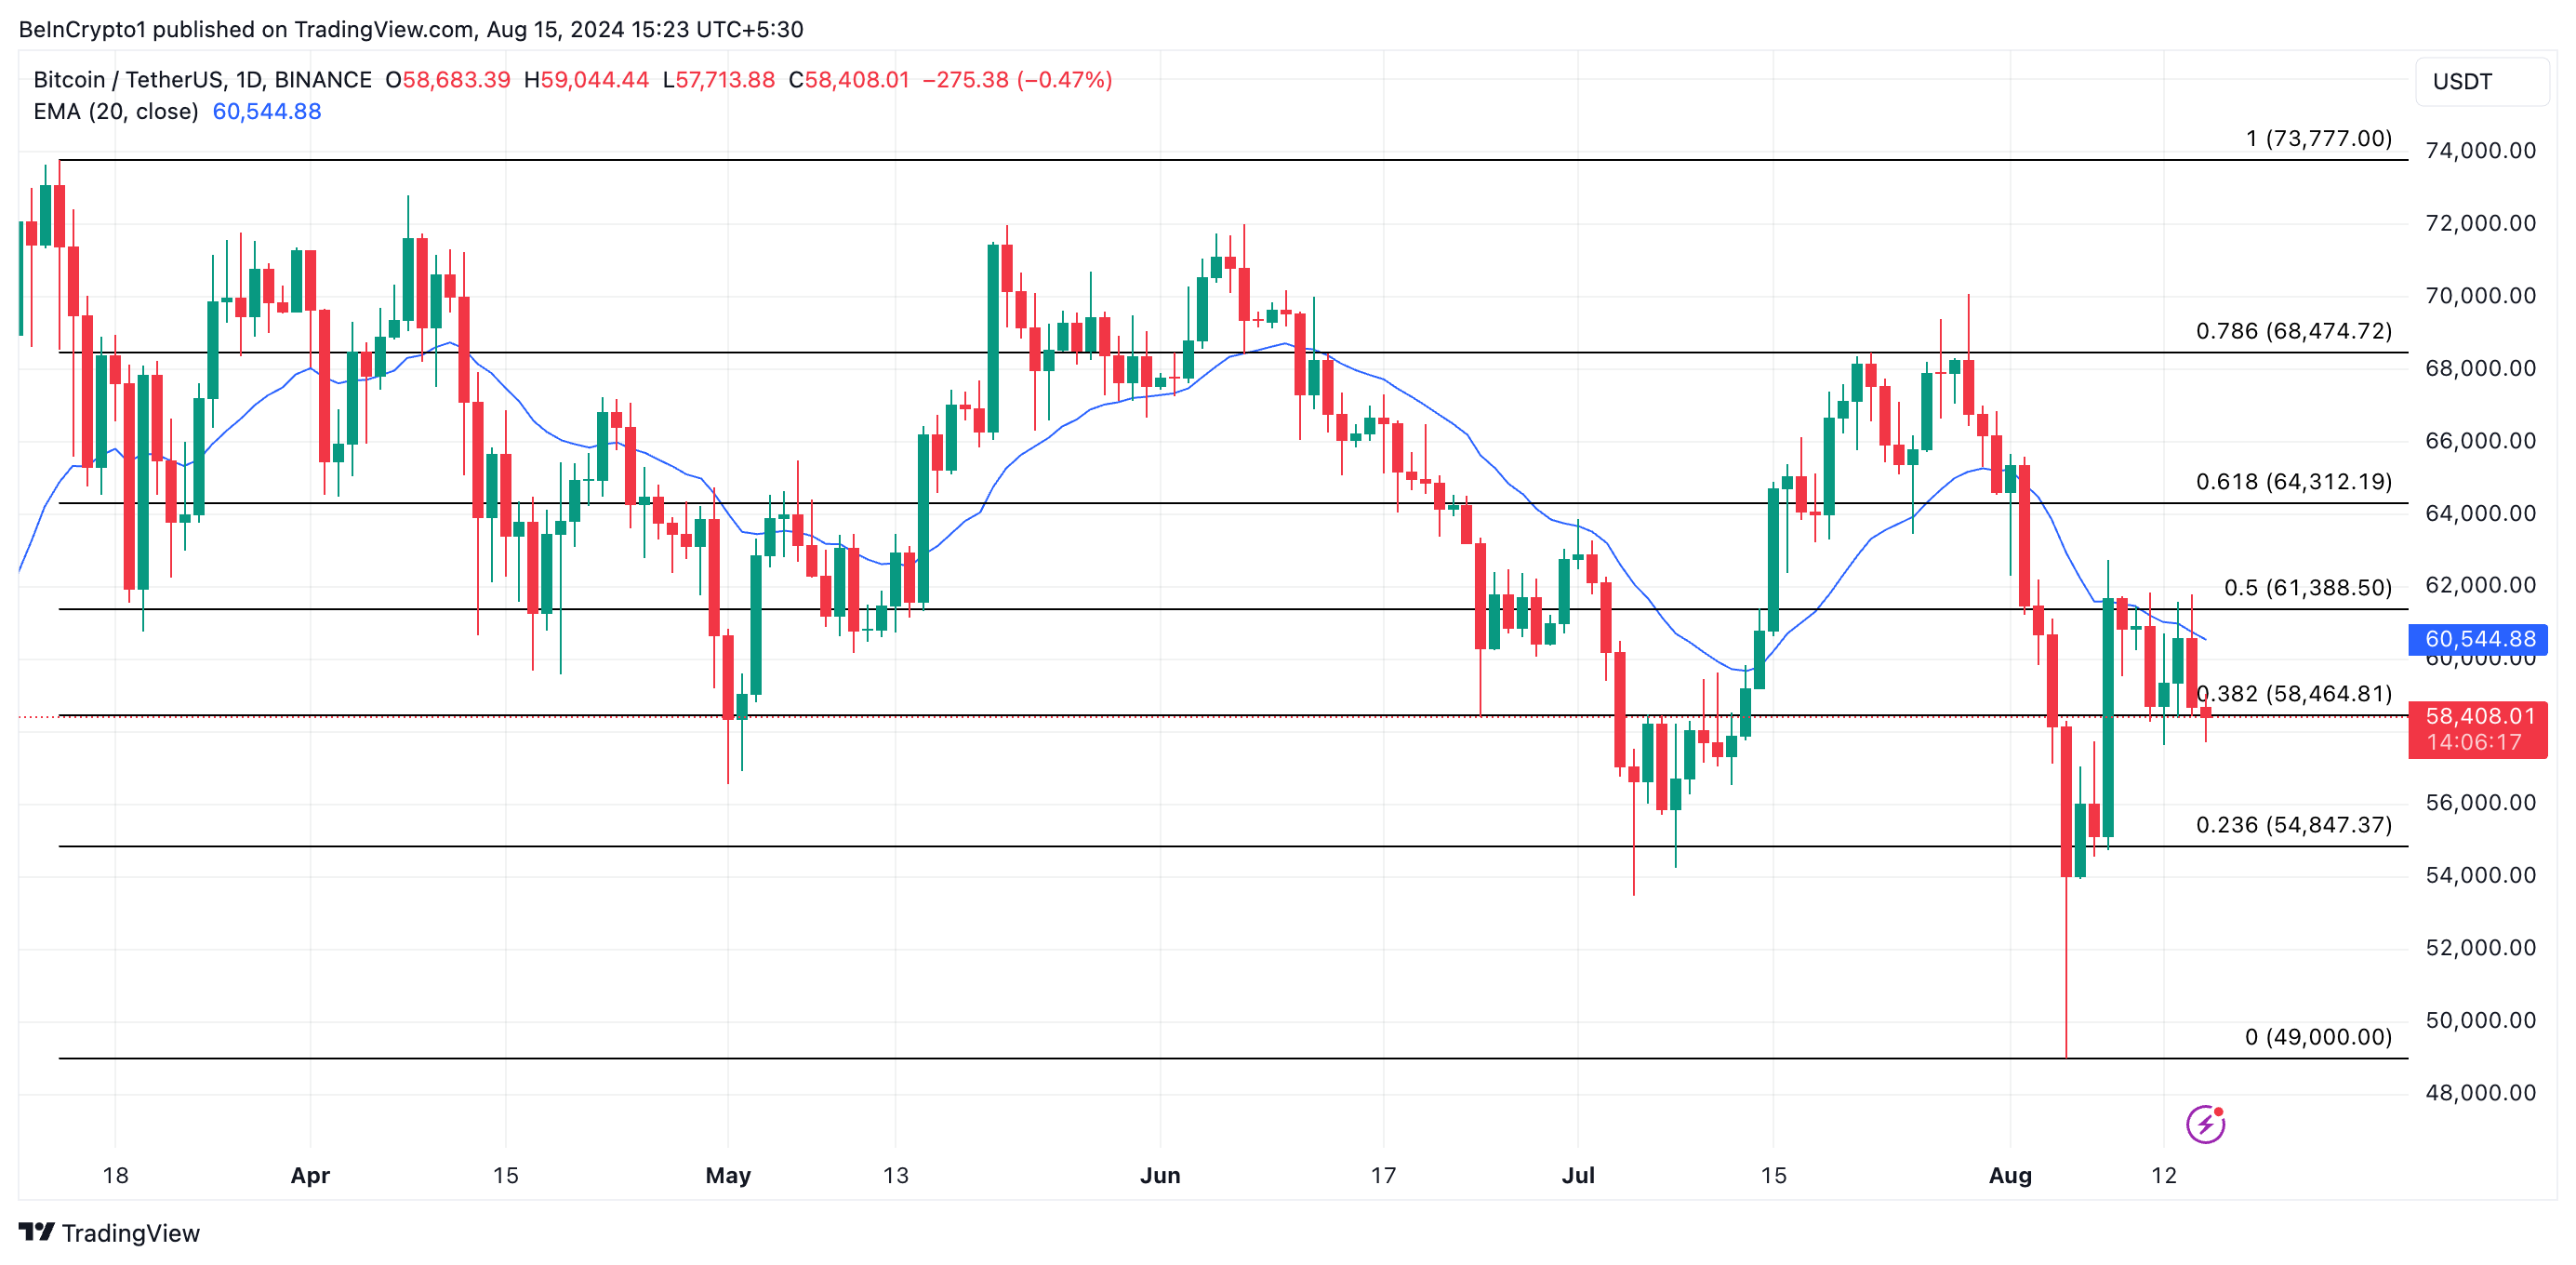 Bitcoin Price Analysis. Source: TradingView
The bearish sentiment surrounding Bitcoin’s recent performance is further evidenced by the increasing demand for short positions. The coin’s funding rate across major cryptocurrency exchanges has turned negative, currently standing at -0.004%. A negative funding rate indicates that traders are more inclined to short the asset, betting on its price falling rather than rising.
“When the funding rate is negative, it shows that the market is bearish,” explained John Todaro, Head of Digital Assets Research at Needham & Company. “Traders are positioning themselves for further declines, and this creates downward pressure on the asset’s price.”
The surge in short positions suggests that many traders are anticipating additional drops in Bitcoin’s value, further complicating its prospects of reclaiming the $60,000 mark.
Bitcoin’s drop below $60,000 has also dragged its price beneath the 20-day exponential moving average (EMA), which tracks the coin’s average price over the past 20 days. The 20-day EMA is a key indicator used by traders to gauge short-term market trends. When an asset’s price falls below this moving average, it typically signals a bearish trend and downward momentum.
“If Bitcoin fails to reclaim the 20-day EMA, we could see it testing lower support levels,” said Katie Stockton, Founder and Managing Partner at Fairlead Strategies. “The next critical support level is around $54,847. If it breaches that, we might be looking at a more extended correction.”
As Bitcoin hovers just below $60,000, the market remains on high alert for further developments. The CPI inflation data, while initially boosting optimism, has not provided the sustained support that many hoped for. Instead, Bitcoin appears to be grappling with broader market forces, including heightened regulatory scrutiny and investor uncertainty.

The release of CPI inflation data is a significant event for markets, as it reflects changes in the cost of living and can influence monetary policy decisions by the Federal Reserve. Lower-than-expected inflation rates often lead to increased investor confidence, as they reduce the likelihood of aggressive interest rate hikes.
However, Bitcoin’s recent performance suggests that the relationship between CPI inflation data and cryptocurrency prices is becoming increasingly complex. While lower inflation is generally seen as a positive economic indicator, Bitcoin’s dip below $60,000 despite the favorable CPI figures highlights the unique factors driving the crypto market.
“The crypto market is still maturing, and it doesn’t always react to traditional economic indicators in the way we might expect,” noted Antoni Trenchev, Co-Founder of Nexo. “Bitcoin’s price action following the CPI data release shows that there are other forces at play, including investor sentiment and market manipulation. “When an asset’s funding rate is negative, there is more demand for short positions. This means more traders are buying the asset in anticipation of a price decline than there are traders acquiring the coin and hoping for a rally.
Bitcoin’s recent “fakeout” following the release of CPI inflation data underscores the volatile nature of the cryptocurrency market. Despite an initial rally, the coin’s inability to maintain its gains above $60,000 has raised concerns about its short-term prospects. As the market adjusts to the latest developments, traders and investors will be closely watching how Bitcoin responds to key support levels and whether it can regain its footing.
The interplay between CPI inflation data and Bitcoin’s price movements is a reminder that, in the world of cryptocurrencies, traditional economic indicators are only part of the puzzle. As Bitcoin navigates through this challenging period, the market will be looking for new signals to guide its next move. The Bit Gazette

Copyright © 2025 - The Bit Gazette.

