


- Trending
- Comments
- Latest

Ethereum is targeting a potential 15% rally to $3,600 as technical indicators signal a bullish reversal and U.S. spot ETF inflows returned to positive territory after a week of outflows.
ETH was trading at $3,113 during Sunday’s Asian session, down 8% over the past week but showing signs of stabilization. The asset has formed an inverse head and shoulders pattern on the weekly chart—a classic bullish setup—while ETH balances on centralized exchanges have fallen to a record low of 8.7%, the lowest level since the network’s 2015 launch.
The recent downtrend was driven by slowing network activity, investor profit taking, macro-economic uncertainty and widespread liquidations across the crypto market. Still, multiple on-chain and market indicators now point to a consolidation phase that could precede a bullish breakout thereby reinforcing the current Ethereum price prediction narrative.
One key signal supporting a positive Ethereum price prediction is the sharp decline in ETH held on centralized exchanges. Exchange balances have dropped to a record low of 8.7%, the lowest level since Ethereum launched in 2015.
This reduction comes as more ETH is locked into staking, restaking protocols and digital asset treasuries focused on accumulation. Notably, Tom Lee-led Bitmine, added another $73.2 million worth of ETH to its holdings just yesterday.
Historically, falling exchange balances reduce sell side pressure which can support higher prices if demand remains steady, a dynamic that strengthens the medium term Ethereum price prediction.
Another bullish factor shaping the Ethereum price prediction is the return of institutional interest. U.S. spot Ethereum ETFs recorded nearly $209 million in net inflows over the past week reversing the prior week’s outflows. Sustained ETF demand often signals growing institutional confidence, which can act as a catalyst for price appreciation.
From a technical perspective, the weekly chart shows Ethereum forming a large inverse head and shoulders pattern a classic bullish reversal structure. This formation further reinforces the broader Ethereum price prediction outlook.
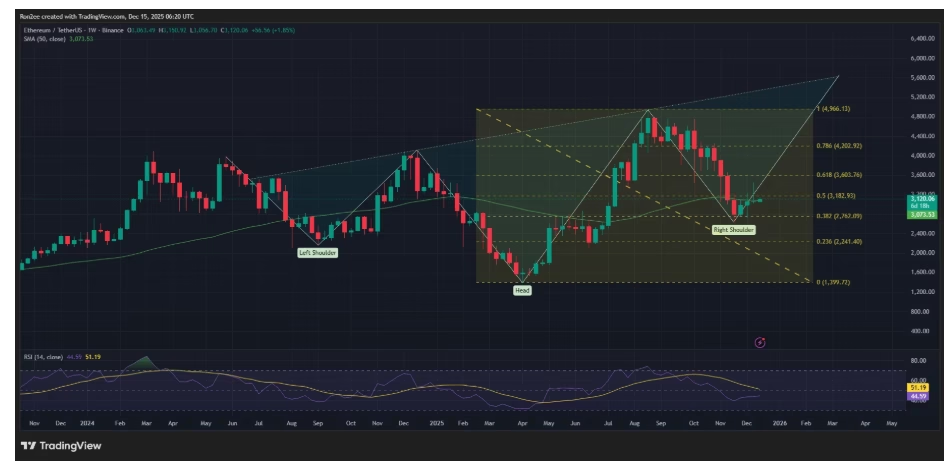
In addition, Ether has reclaimed the 50-day moving average, a level that previously marked the start of strong rallies. The relative strength index (RSI) is also trending upward indicating that buying momentum is gradually returning which indicates another positive signal for the evolving Ethereum price prediction.
If the bullish setup plays out, the next key target for Ether sits near $3,600, representing a potential 15.65% upside from current levels. This zone aligns with the 61.8% Fibonacci retracement level making it a critical resistance area traders are likely to monitor closely as part of their Ethereum price prediction strategy.
On the downside, $2,760 near the 38.2% Fibonacci retracement level stands out as the next major support to watch if selling pressure resumes which could temporarily weaken the near term Ethereum price prediction.

Copyright © 2025 - The Bit Gazette.

