


- Trending
- Comments
- Latest
Solana processed more than 2 billion transactions over the past 30 days—30 times more than Ethereum—even as its native token dropped 15% from its January peak to around $127, creating a stark disconnect between network fundamentals and price action that analysts say could signal a buying opportunity.
According to data compiled by Nansen, Solana’s network activity remains exceptionally strong reinforcing the bullish undertone behind this Solana price prediction.
Over the past 30 days, the blockchain processed more than 2 billion transactions, far exceeding the combined totals of major rivals. By comparison, Ethereum recorded about 63 million transactions while BNB Chain handled roughly 438 million.
User growth has also accelerated, strengthening the broader price prediction outlook.
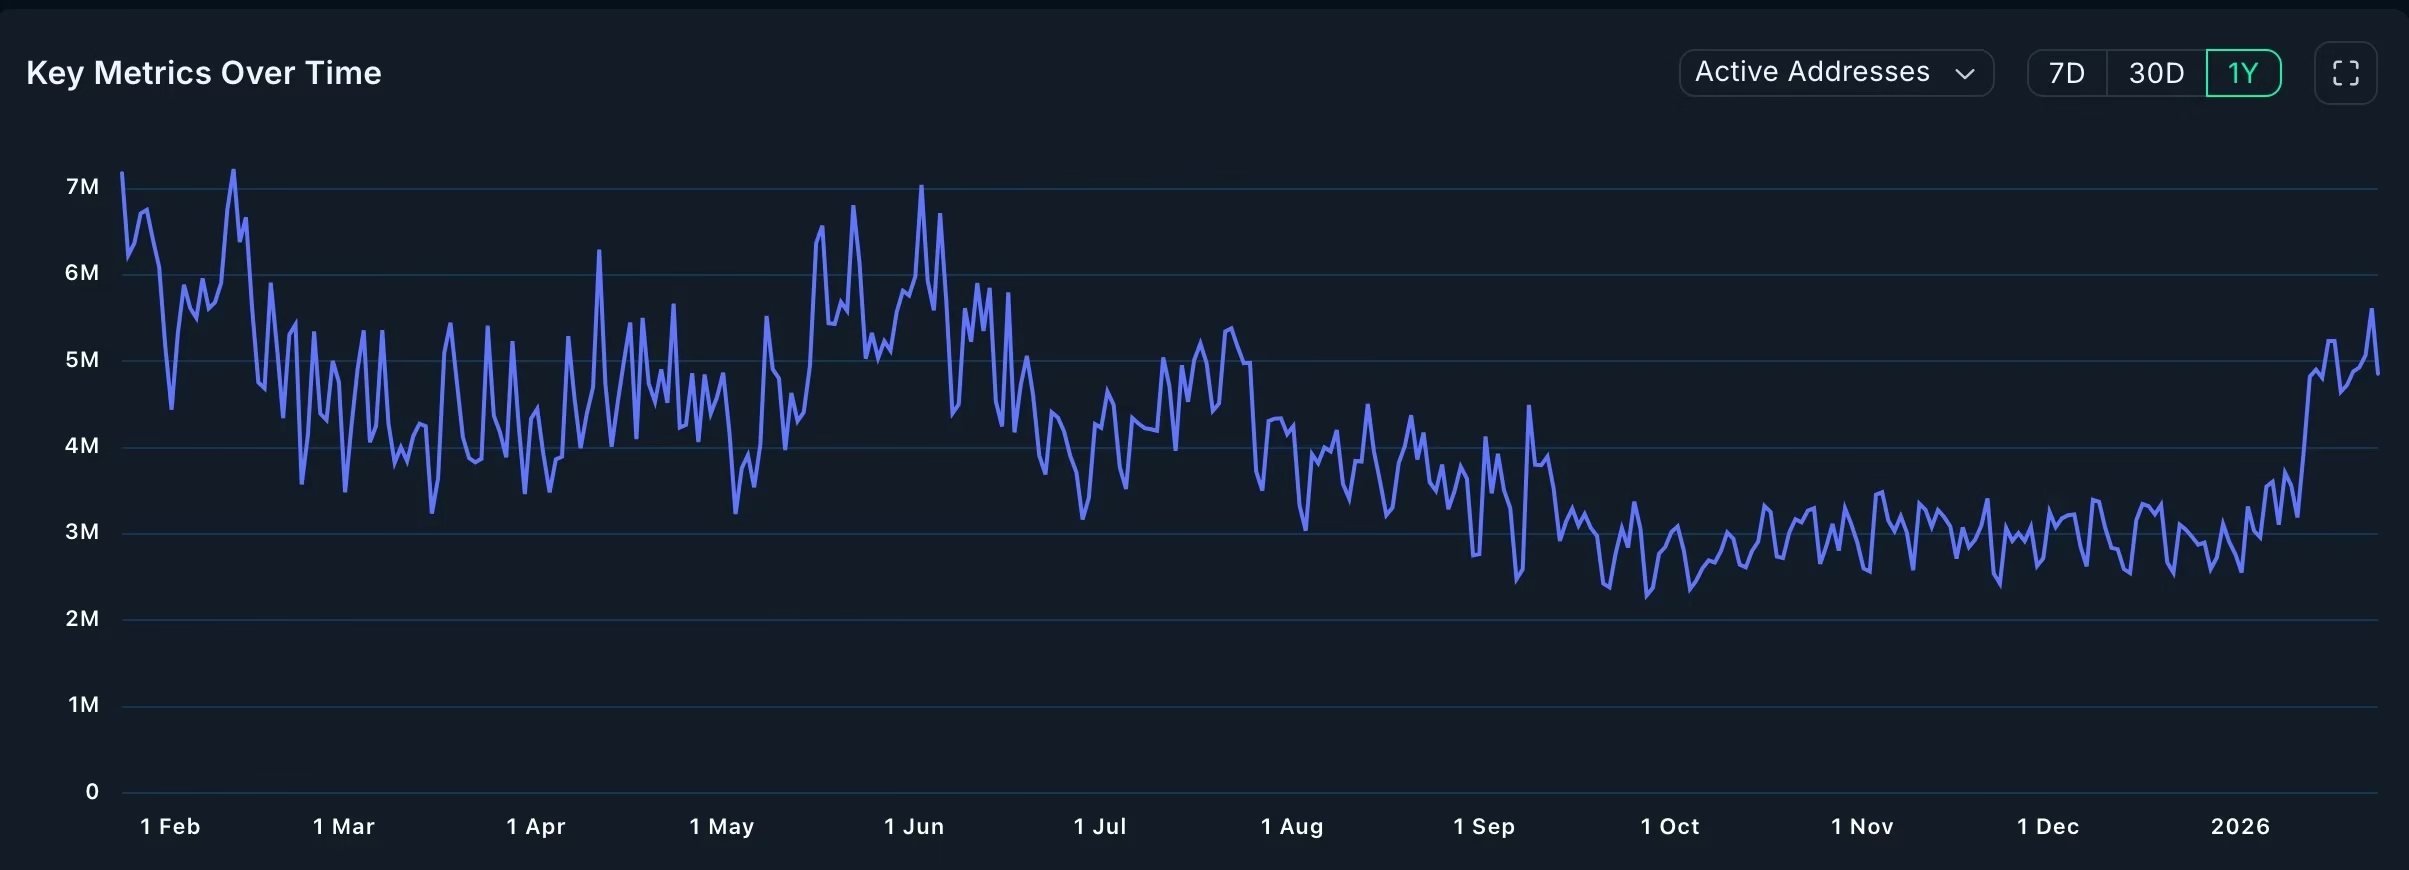
Active addresses climbed by 34% to 81.2 million in the last month while network fees surged 42% to over $20 million during the same period.
This expansion has been supported by consistent decentralized exchange and stablecoin activity, a key pillar of this price prediction narrative.
Solana based DEX protocols processed more than $107 billion in volume, surpassing Ethereum, Base, and BNB Chain combined.
Stablecoin usage has been equally impressive and continues to support the price prediction thesis. Transaction volume jumped above $312 billion with more than 260 million stablecoin transfers recorded.
The ecosystem now hosts over 4.5 million stablecoin addresses, underscoring its growing role in on-chain payments and liquidity.
Looking ahead, long term fundamentals remain favorable adding confidence to the broader Solana price prediction.
Developers are preparing for the highly anticipated Alpenglow upgrade which is expected to significantly improve network performance and scalability potentially attracting even more users and applications.
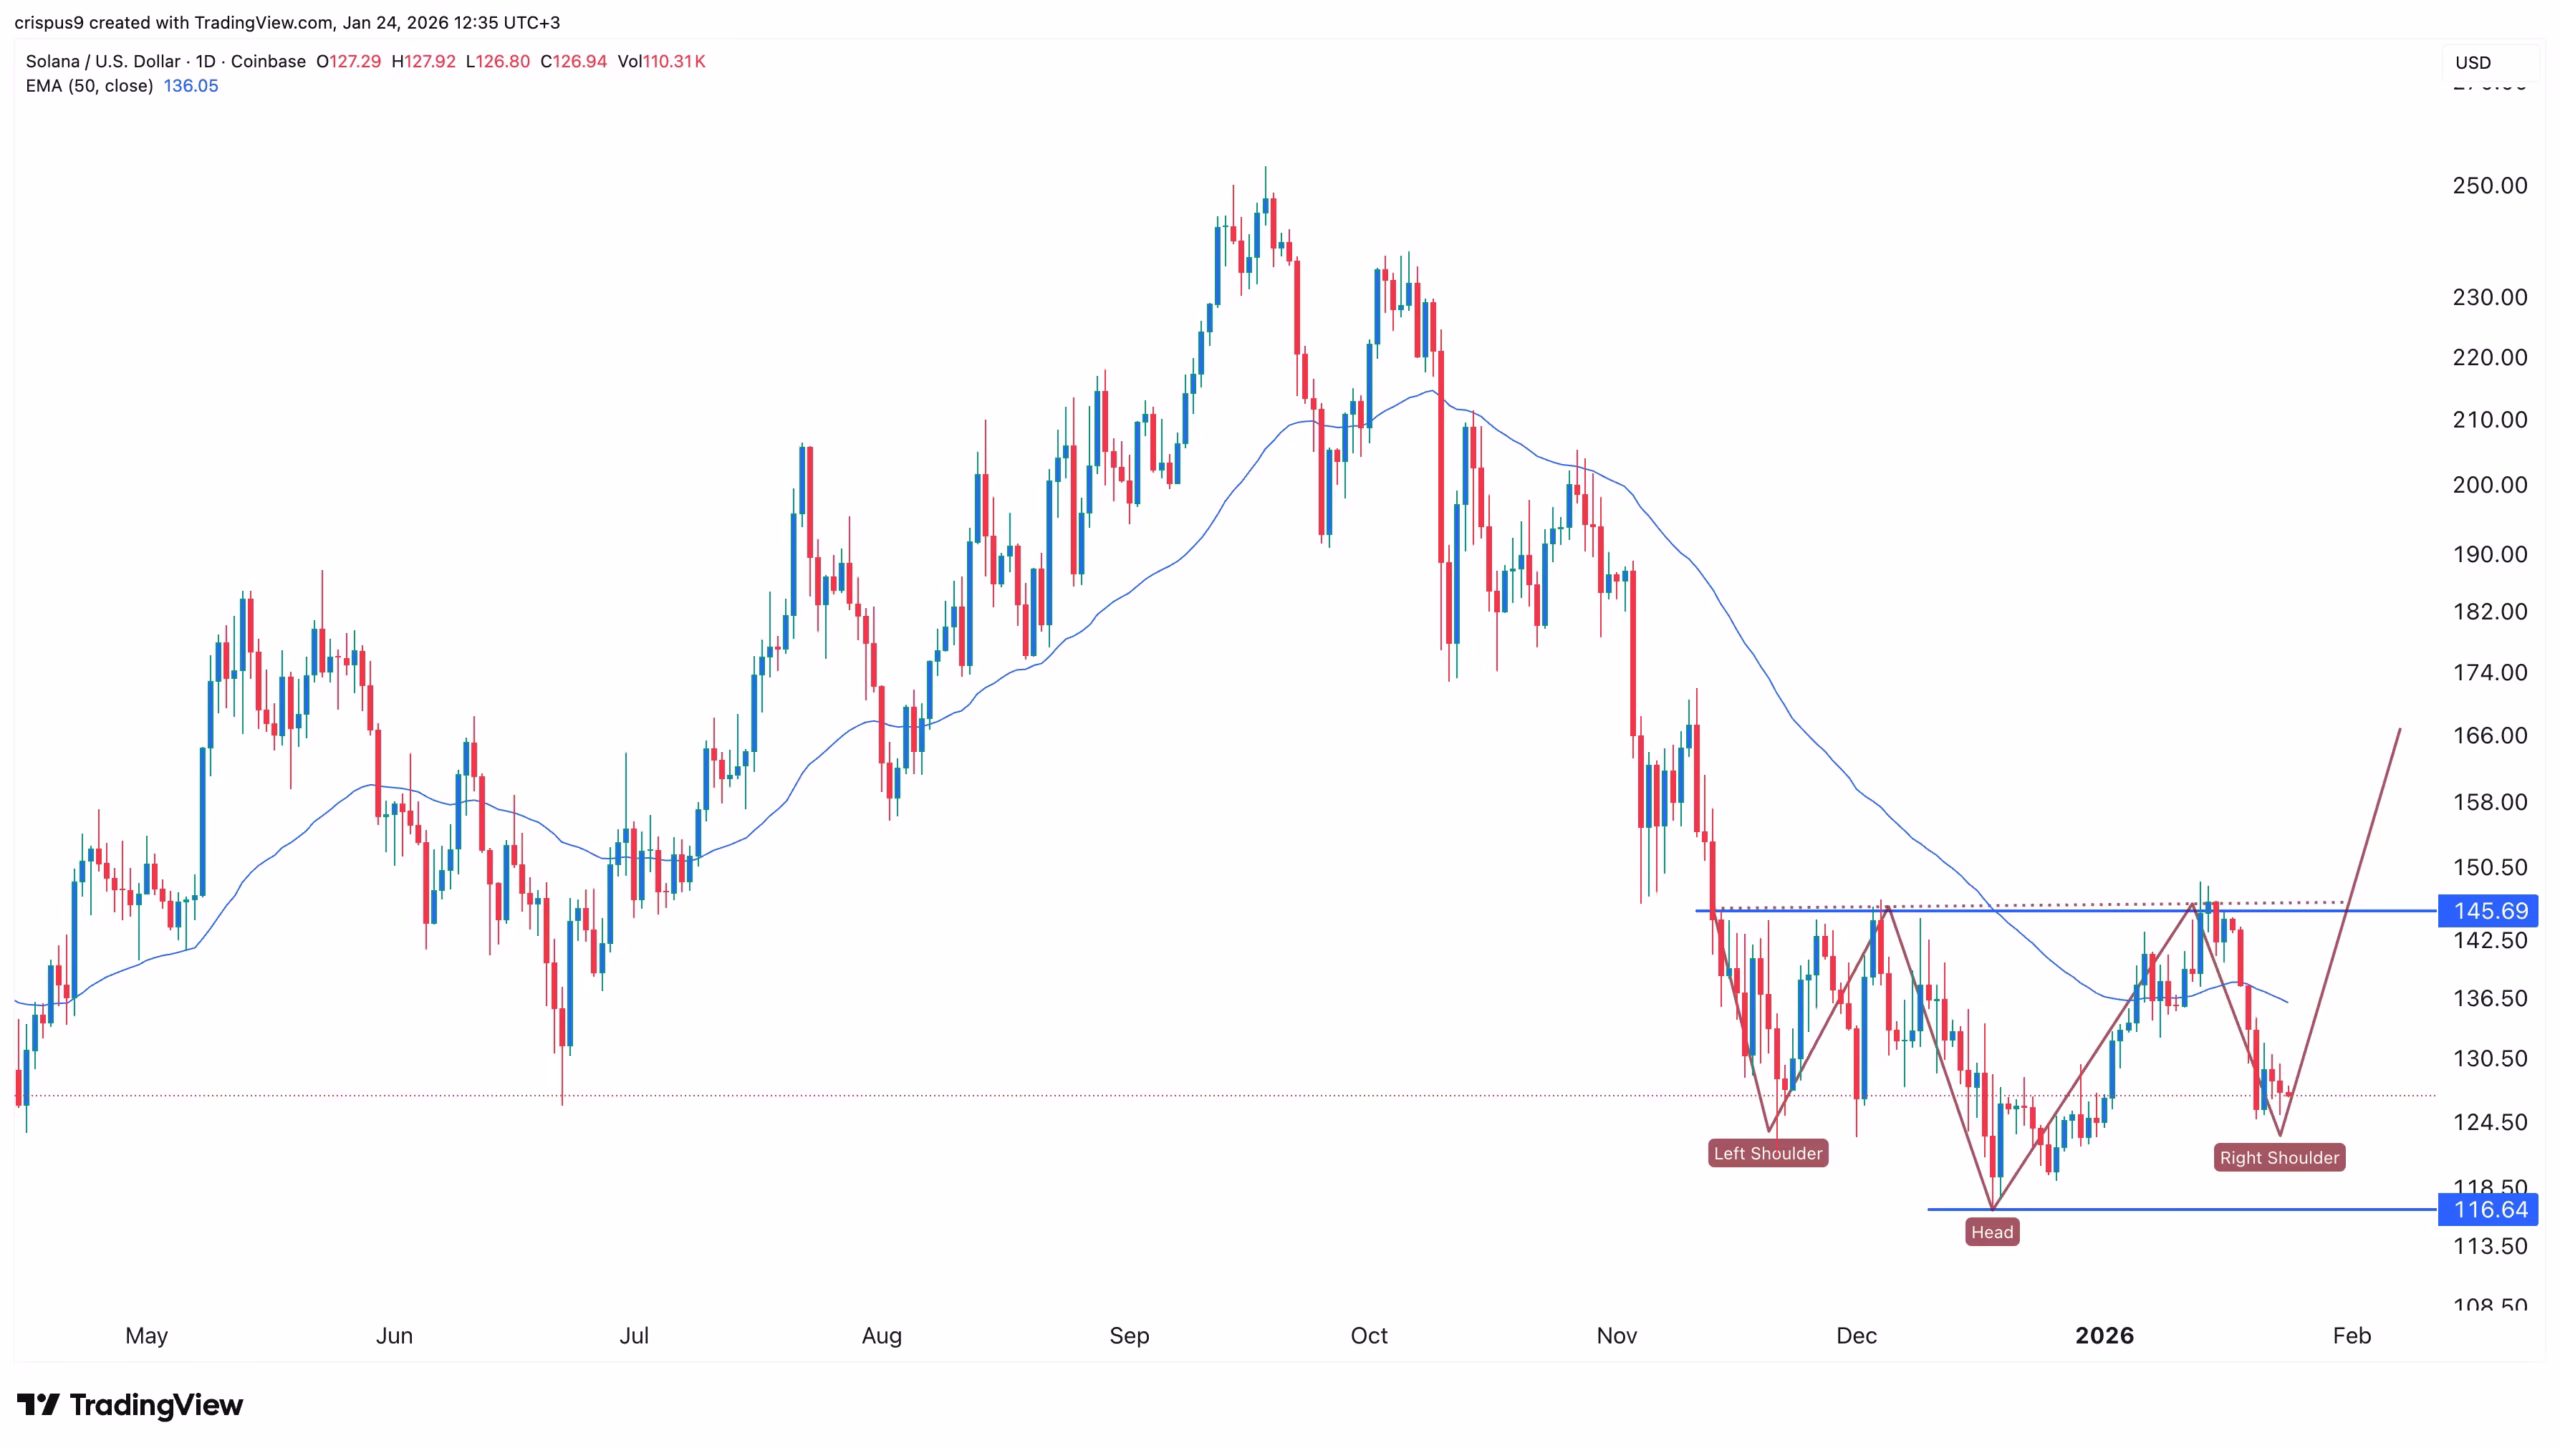
From a technical perspective, this price prediction considers recent price action on the daily chart which shows SOL retreating from a year to date high of $148 to around $126.
Despite the pullback, chart patterns suggest that downside momentum may be weakening.
Solana has formed an inverted head and shoulders pattern and appears to be building the right shoulder. It has also developed a cup and handle structure both of which typically signal a potential upside breakout.
Based on this setup, the most likely price prediction scenario points to a rebound toward the $148 level in the coming weeks.
A decisive move above that resistance could open the door to further gains potentially targeting the psychological $200 mark.
On the downside, a break below the key support zone at $118 would invalidate this bullish Solana price prediction and suggest deeper losses in the near term.

Copyright © 2025 - The Bit Gazette.
