


- Trending
- Comments
- Latest
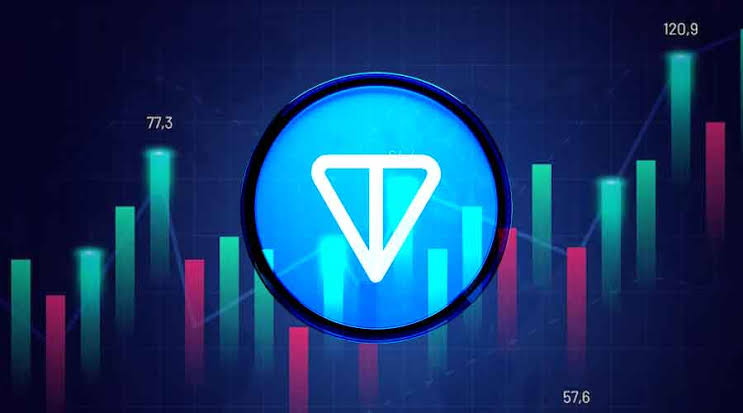
Toncoin (TON) has captured the attention of the cryptocurrency market with a notable price surge of 7% on the morning of August 19, solidifying its position as the top performer among major digital assets. At the time of writing, TON is trading at $6.92, reflecting a 6% gain for the day, according to data from crypto.news. With a daily trading volume that has soared by 143% to approximately $568 million, and a market cap standing at $17.3 billion, Toncoin now ranks as the ninth-largest cryptocurrency by market capitalization.
This TON price analysis delves into the recent bullish trends, the technical indicators that suggest where the coin might head next, and the factors driving its upward momentum.
Toncoin’s current price positions it well above the middle Bollinger Band, which stands at $6.3421, and significantly higher than the lower band at $5.4265. This favorable placement within its recent trading range indicates a strong recovery from previous lows. Although TON remains below the upper Bollinger Band at $7.2578, this gap suggests that there is still room for upward movement before encountering significant resistance.
According to crypto market analyst Alex Krüger, “Toncoin’s positioning above the middle Bollinger Band reflects a healthy bullish trend, but traders should be cautious as the coin approaches the upper band, which often serves as a resistance level.”
The Directional Movement Index (DMI) further supports the bullish outlook in this TON price analysis. The +DI line, representing the strength of upward price movements, currently stands at 24.8112, overtaking the -DI line at 18.8496. This suggests that recent price actions have been predominantly bullish. Additionally, the average Directional Index (ADX) line is at 24.7785, which is just shy of the critical 25 level that typically signals a strong trend, whether bullish or bearish.
Crypto technical analyst Benjamin Cowen notes, “The ADX value nearing 25, combined with a dominant +DI line, indicates that Toncoin is in a robust bullish phase. However, it is crucial to monitor these indicators closely, as any shift in momentum could lead to increased bearish pressures.”
Another key factor in this TON price analysis is the surge in trading volumes and open interest. The significant increase in daily trading volume by 143% to $568 million reflects heightened market activity and investor interest in Toncoin. Furthermore, data from CoinGlass reveals that the total open interest in TON increased by 14.7% over the past 24 hours, rising from $246.83 million to $283.03 million. This uptick in open interest is a strong signal that traders are increasingly betting on TON’s continued price movements.
According to crypto trader and strategist Josh Rager, “The rise in open interest and trading volume suggests that Toncoin’s rally is supported by substantial market participation, which is often a precursor to sustained price increases.”
While the overall market sentiment is bullish, the Relative Strength Index (RSI) presents a more neutral outlook. Currently, the RSI for TON stands at 55.58, indicating that the asset is neither overbought nor oversold. This neutral reading suggests that Toncoin is not at immediate risk of a sharp reversal due to overvaluation. However, it also means that the recent upward trend might not persist without additional buying pressure.
Crypto analyst Lark Davis points out, “The RSI being in a neutral zone implies that Toncoin could move in either direction, but with the current bullish momentum, the coin may continue to rise unless external market factors introduce bearish sentiment.”
This TON price analysis highlights the importance of closely monitoring key technical indicators as Toncoin continues its upward trajectory. The proximity to the upper Bollinger Band at $7.2578 is a critical level that could either act as a resistance point or, if breached, signal further gains. Additionally, maintaining high trading volumes and positive +DI values will be crucial for sustaining the bullish momentum.

However, caution is warranted. Should trading volumes decrease while prices remain elevated, or if the negative directional indicator (-DI) overtakes the positive directional indicator (+DI), it could signal the onset of a price correction. Traders and investors should also be aware of any external factors, such as broader market movements or regulatory news, that could impact TON’s price.
Toncoin’s recent price surge and robust market activity indicate a strong bullish trend, supported by favorable technical indicators. However, this TON price analysis also underscores the need for vigilance as the coin approaches critical resistance levels. While the rally appears poised to continue, mixed signals from indicators like the RSI suggest that caution is necessary, particularly if market conditions change.
Get more from The Bit Gazette

Copyright © 2025 - The Bit Gazette.

