


- Trending
- Comments
- Latest
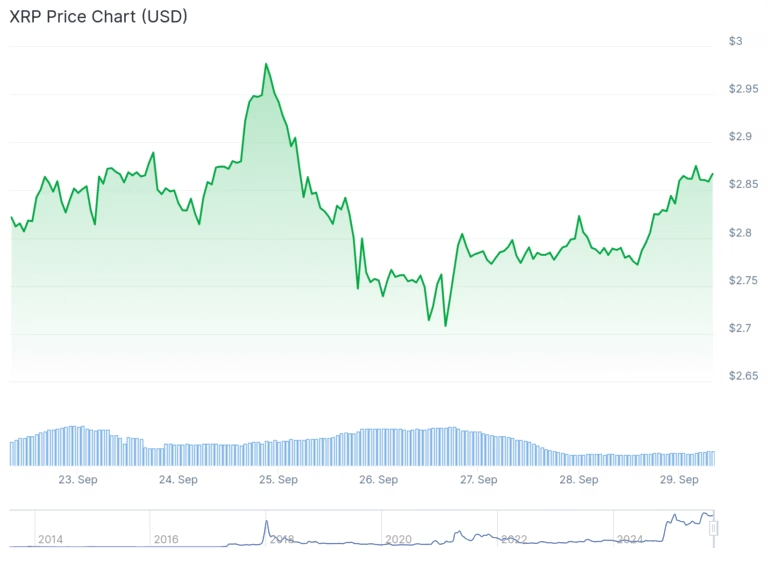
XRP trades near $2.86 following a two-week decline of 14%, and traders are closely monitoring whether it can sustain momentum above its critical support level. This moment marks a decisive phase for the XRP price prediction, as October’s scheduled exchange-traded fund (ETF) decisions could introduce significant volatility.
XRP found strong demand near $2.75, sparking a rebound that mirrored the broader recovery seen in Bitcoin and Ethereum. Technical analysis indicates that the token cleared the 50% Fibonacci retracement from the $2.995 swing high to the $2.70 low, but now faces resistance at $2.88.
A symmetrical triangle formation on the daily chart places emphasis on the $2.75 support level. Glassnode data shows nearly 1.58 billion XRP were acquired around this price, reinforcing its importance. Should XRP hold this level, a breakout toward $3.62 remains possible.
“XRP is in solid bullish consolidation as long as price holds above the $2.72–$2.75 range,” — Analyst commentary from market report.
The $2.75 mark has become the defining level for the XRP price prediction, aligning with the September 1 monthly open. Analysts warn that slipping below this threshold could invalidate the bullish setup and set the stage for a decline toward $2.00, the bearish target implied by the symmetrical triangle.
Conversely, breaking above $2.81 and overcoming the 100-day simple moving average could trigger a rally of nearly 30%, taking XRP to the $3.62 target. Resistance levels remain stacked at $2.88, $2.92, and $3.05, while support clusters around $2.80 and $2.72.
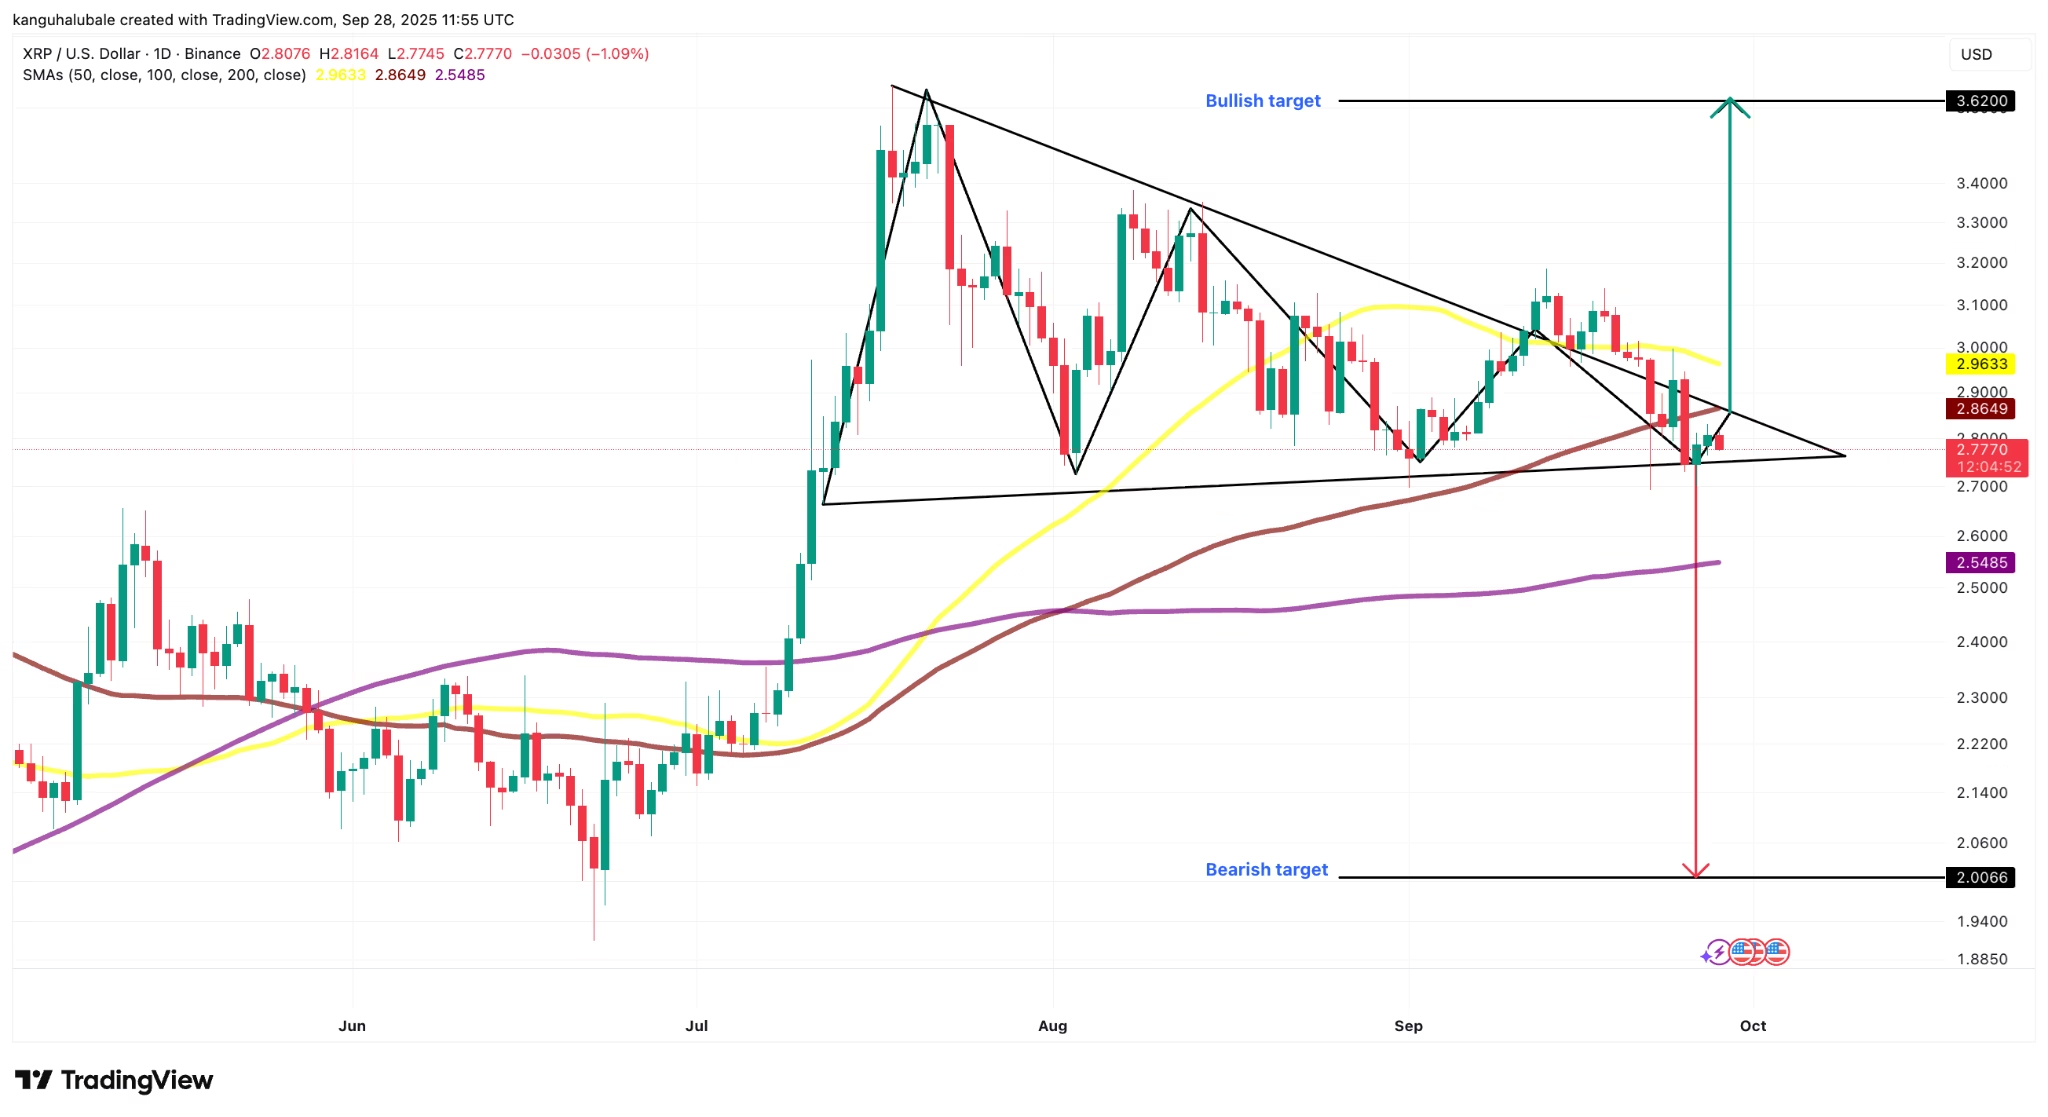
“Maintaining price stability above $2.75 increases the likelihood of breaching $2.86 and achieving bullish continuation,” — Technical analysis insight from TradingView charts.
Indicators present a mixed short-term picture: the hourly MACD continues in the bullish zone, while the RSI hovers slightly above 50, suggesting momentum could swing either way.
History complicates the XRP price prediction for October. Since 2013, XRP has delivered negative returns in seven of the last 12 Octobers, averaging a 4.58% decline. This seasonal weakness adds caution to the current recovery attempts.
Despite October struggles, Q4 remains XRP’s strongest quarter historically, with average gains of 51%. Notably, Q4 2024 delivered a 240% surge, while Q4 2017 posted an exponential 1,064% increase. Even during downturns in 2018 and 2022, the last quarter consistently brought significant rallies.
Data from CryptoRank confirms that the October-to-December period is the only quarter with consistent average gains, raising hopes that XRP could recover strongly in late 2025. If the pattern repeats, a rebound may begin by mid-October, coinciding with ETF decision timelines.
The most immediate factor shaping the XRP price prediction is the wave of ETF approvals expected between October 18–25. Franklin Templeton’s decision has been pushed to November 14, while Grayscale’s ruling is due October 18. Approval of any XRP-related ETF could introduce fresh institutional inflows and provide critical upward momentum.
Until then, XRP remains at the mercy of its $2.75 support. Traders view this level as the line between bullish continuation and a sharp correction toward $2.00. With ETF rulings looming and historical seasonality weighing on sentiment, October may define whether XRP enters a sustained rally or faces renewed downside pressure.

Copyright © 2025 - The Bit Gazette.

