


- Trending
- Comments
- Latest
Bitcoin traded near $91,000 Tuesday as a bearish ABCD harmonic pattern targets the $83,800 level, even as ARK Invest and El Salvador deployed a combined $110 million into cryptocurrency assets.
Cathie Wood’s ARK Invest purchased $10.2 million in shares of crypto exchange Bullish on Monday, while El Salvador added 1,090 bitcoin worth approximately $100 million to its national holdings, defying previous commitments to the International Monetary Fund to limit purchases.
The institutional and sovereign buying occurred as bitcoin declined from above $126,000 in early October to current levels, erasing approximately $600 billion in market capitalization.
ARK Invest acquired $10.2 million in Bullish shares across its flagship ETFs—ARKK, ARKW, and ARKF—as crypto-linked stocks declined. Bullish stock fell 4.5% to $36.75 on Monday, extending a six-month decline of nearly 46%.
The purchase came one day before Bullish’s third-quarter earnings report. The timing signals confidence in a potential recovery despite short-term sector volatility, according to market observers.
El Salvador purchased 1,090 bitcoin worth more than $100 million, raising its holdings to over 7,474 BTC from 5,968 BTC in December 2024, according to government data.
The acquisition contradicts El Salvador’s $1.4 billion loan agreement with the IMF, which included restrictions on bitcoin purchases. The IMF had claimed earlier this year that El Salvador had not purchased additional bitcoin since the loan arrangement was finalized.
The IMF previously requested that El Salvador reduce risks by limiting bitcoin publicity and minimizing the public sector’s involvement in the Chivo wallet. The recent large-scale purchase raises questions about the country’s compliance with the agreement terms.
Bitcoin remains under selling pressure as a bearish ABCD harmonic pattern unfolds on the daily chart, targeting potential completion near $83,800—a demand zone that previously triggered rebounds in early 2024.
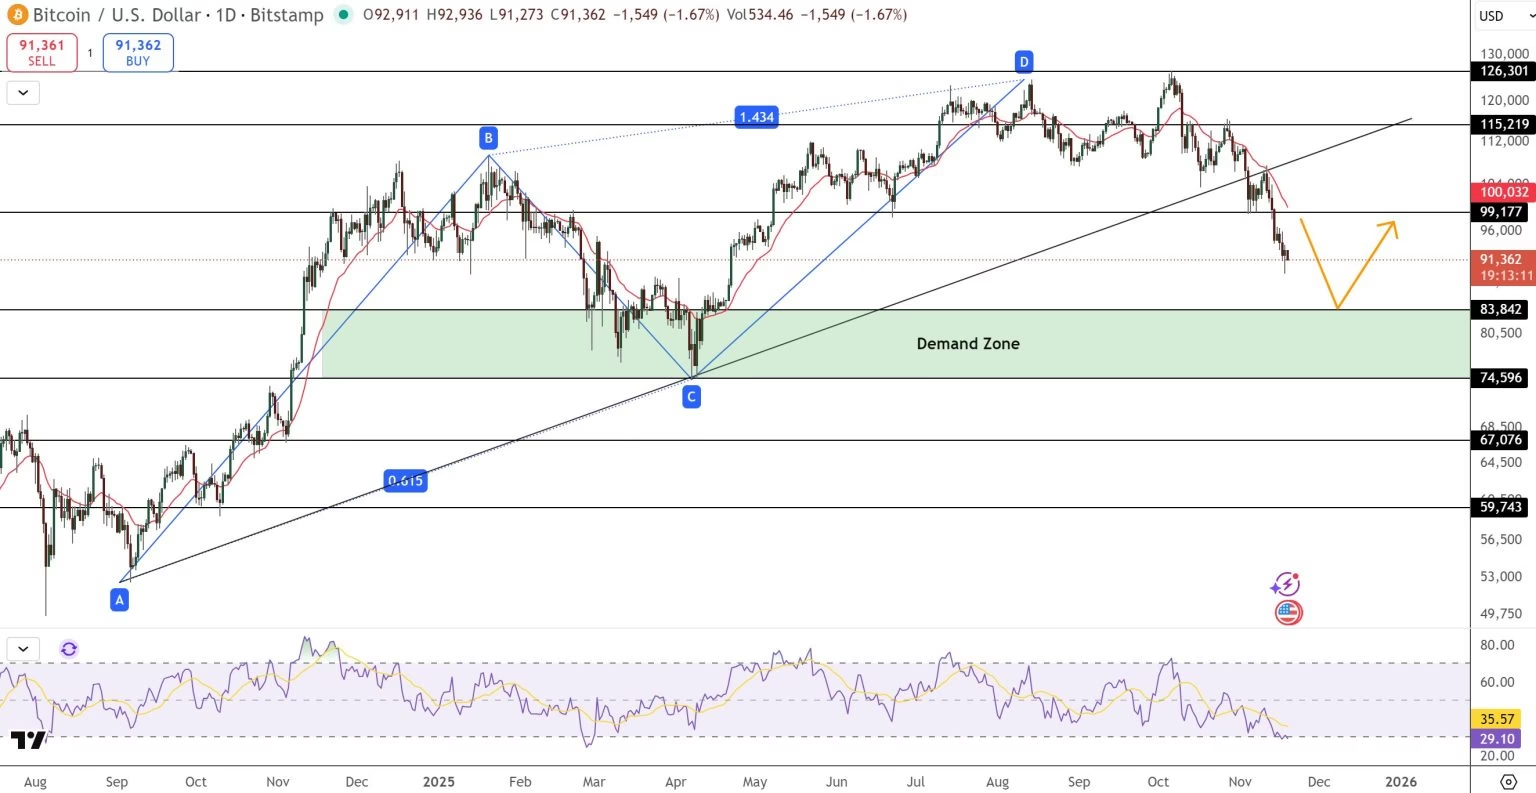
The pattern’s “AB” leg declined from $115,200 to $99,000, mirroring the ongoing “CD” leg and suggesting downside momentum may near exhaustion. The 20-day exponential moving average crossing below the 50-day EMA confirms short-term bearish control, while the relative strength index hovering around 30 indicates oversold conditions.
Candlestick patterns show long lower wicks, suggesting buyers are entering near support levels. If the $83,800 zone holds, a rebound toward $96,000 and potentially $99,000 could follow, with the broken trendline acting as resistance.
Failure to maintain support above $83,000 would expose bitcoin to deeper declines toward $74,500, aligning with the lower boundary of the broader accumulation range, according to technical analysis.
For traders, confirmation through a bullish engulfing or hammer candlestick pattern at the demand zone could signal a turning point. Despite current weakness, bitcoin’s structure supports potential recovery heading into 2026, with the ABCD pattern potentially marking the final leg of this correction before the next upward phase.

Copyright © 2025 - The Bit Gazette.

