


Bitcoin has rebounded more than 4% since February 19 to reclaim $68,200, but analysts warn the rally is sitting on fragile ground — a head-and-shoulders pattern on the 8-hour chart, a surge in leveraged long positions to $20.71 billion in open interest, and an on-chain supply cluster near $66,800 that could trigger cascading sales if breached.
Analysts tracking derivatives positioning, chart formations, and blockchain supply metrics warn that the market could be nearing its most vulnerable point of 2026.
Bearish Structure Raises Immediate Bitcoin Price Prediction Concerns
Current technical structure is the primary driver behind the latest Bitcoin price prediction warnings. On the 8-hour chart, analysts have identified a classic head-and-shoulders formation — a pattern widely regarded by technicians as a bearish reversal signal. It forms when price records three peaks, with the center peak higher than the two surrounding highs, indicating fading buying pressure.
Momentum data reinforces this cautionary Bitcoin price prediction outlook. Between February 6 and February 20, price action produced a lower high while momentum indicators climbed higher. This hidden bearish divergence suggests the recovery lacked strong conviction from buyers.
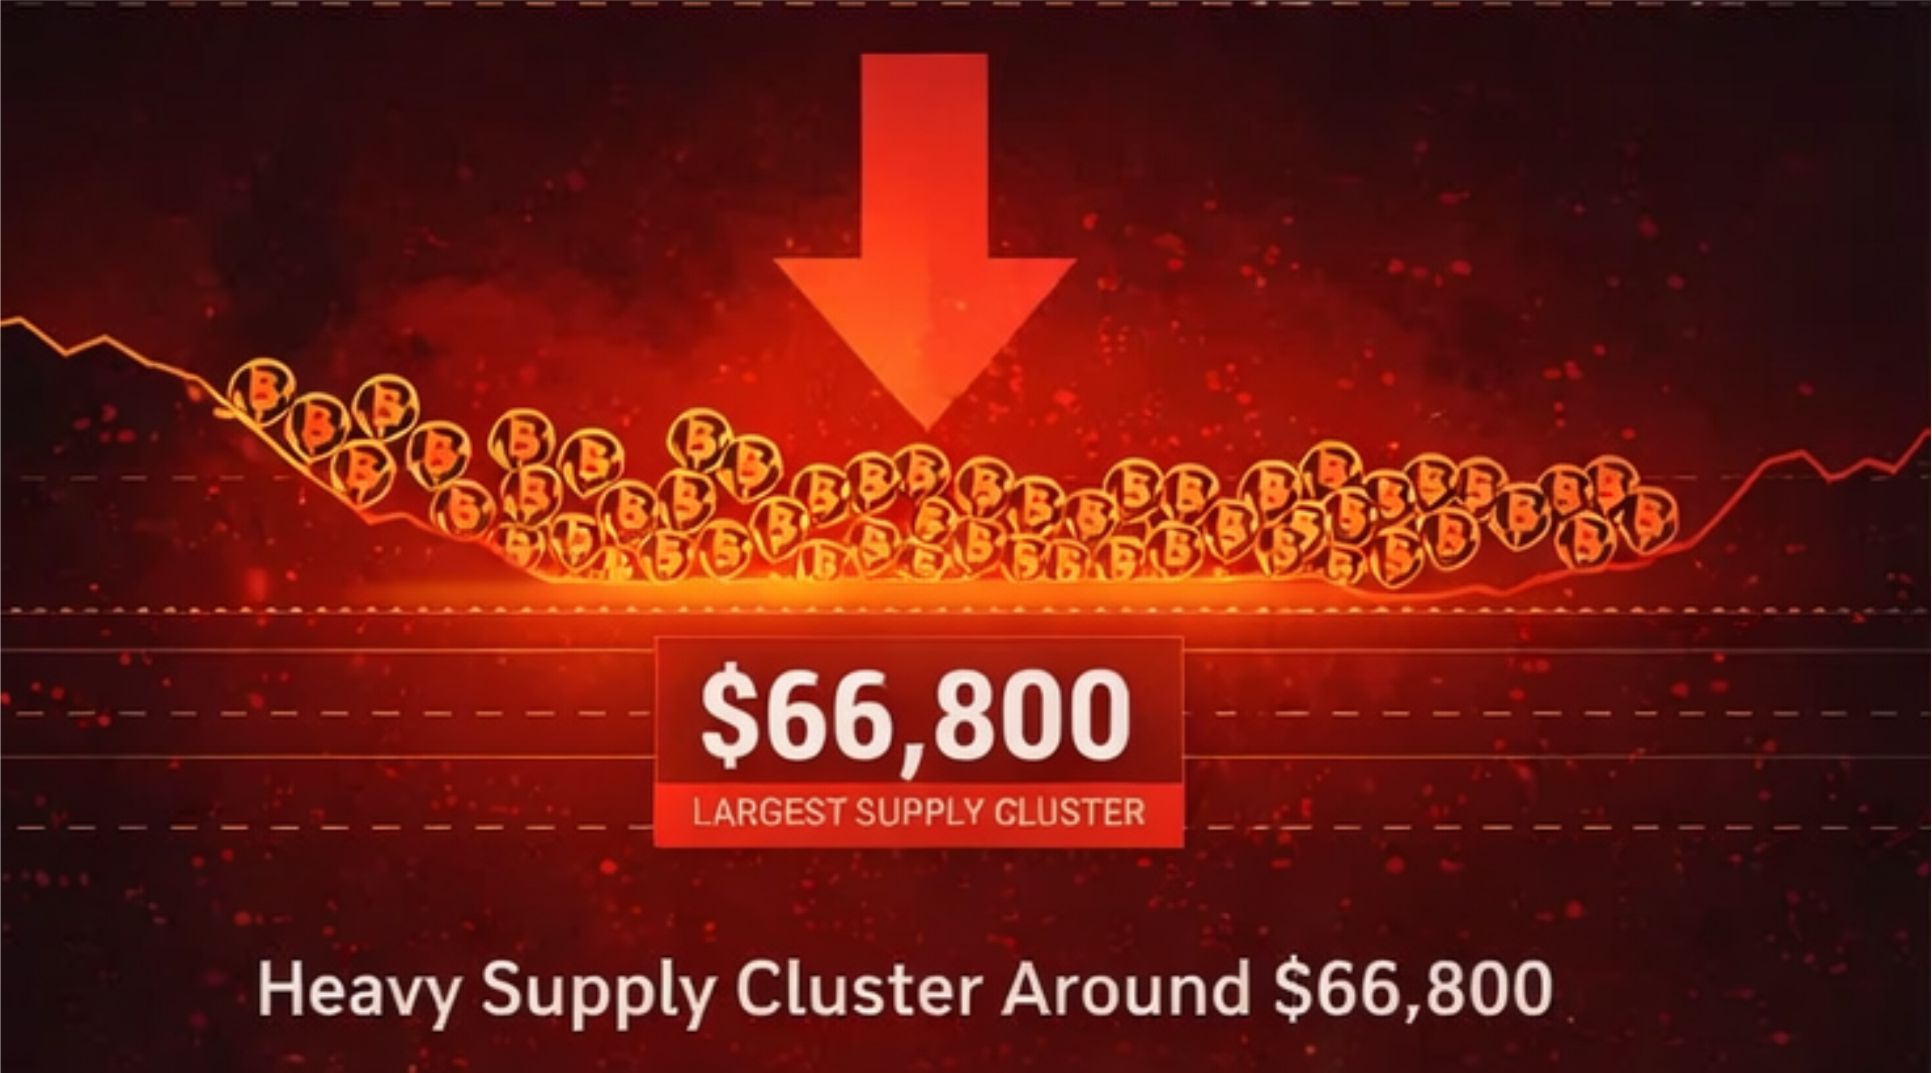
Supply analytics deepen the risk narrative. On-chain distribution metrics show that more than 4.5% of circulating coins sit just below current price levels. That concentration creates a dense liquidity pocket that could accelerate selling if support fails. In practical terms, such clusters often act like trapdoors — once price drops into them, selling pressure can cascade quickly.
Market historian and Berkshire Hathaway chairman Warren Buffett once warned that speculative assets can fall rapidly when sentiment flips, famously describing cryptocurrencies as “rat poison squared.” While his stance is controversial among crypto supporters, risk analysts say the remark reflects a reality markets repeatedly demonstrate: fragile rallies can unwind fast.
Leverage Surge Complicates the Bitcoin Price Prediction Outlook
Derivatives positioning adds another layer to the Bitcoin price prediction debate. Open interest — the total value of outstanding futures contracts — jumped from about $19.54 billion on February 19 to roughly $20.71 billion during the rebound. Rising open interest during price increases typically indicates traders are entering leveraged longs rather than spot buyers accumulating coins.
That distinction matters because leveraged positions can trigger rapid liquidations if price turns lower. A crowded trade makes any downside move more violent, amplifying volatility and accelerating corrections.
Momentum indicators support the cautious Bitcoin price prediction narrative. The Relative Strength Index posted a higher high while price failed to do the same. Technicians interpret this divergence as a sign that buying strength is weakening even as traders attempt to push prices upward.
Executives in traditional finance have repeatedly warned about leverage risks in crypto markets. Jamie Dimon, chief executive of JPMorgan Chase, has stated that excessive speculation and leverage make digital assets prone to sharp corrections. Analysts note that his caution aligns with the current Bitcoin price prediction signals emerging from derivatives data.
On-Chain Cost Basis Levels Signal a Critical Support Zone
Blockchain analytics now play a central role in any serious Bitcoin price prediction. One key metric, the UTXO Realized Price Distribution, maps where coins last moved on-chain, effectively revealing price zones where large numbers of holders bought in.
Current readings show the largest supply cluster sits just above $66,800, representing about 3.17% of circulating supply. This makes it a crucial support region. If price closes decisively below that band, the technical head-and-shoulders pattern could confirm — a development that would significantly strengthen bearish Bitcoin price prediction scenarios.
Long-term investors, however, continue to frame corrections as cyclical rather than catastrophic. Cathie Wood, leader of ARK Invest, has repeatedly argued that volatility is intrinsic to emerging technologies and has predicted that Bitcoin could exceed $1 million in the long run. Supporters cite such forecasts to counter short-term Bitcoin price prediction fears.
Why Analysts Say the Next Move May Decide 2026’s Trend

Market strategists emphasize that the current Bitcoin price prediction environment is unusually compressed. Price sits between heavy resistance above and dense supply below, creating what traders call a “decision zone.” Breakouts from such ranges often set the tone for months.
If bulls defend the $66,800 region, confidence could return quickly and invalidate bearish chart structures. But if that level fails, analysts say the path toward $56,000 becomes technically plausible — a scenario now circulating widely in institutional Bitcoin price prediction models.
Veteran macro trader Paul Tudor Jones once described Bitcoin as “the fastest horse in the race” for inflation hedging. Yet even he has stressed that volatility is unavoidable. That duality captures today’s market psychology: strong long-term conviction coexisting with fragile short-term positioning.
For now, traders are watching support levels, leverage metrics, and momentum signals closely. Each new data point feeds into the evolving Bitcoin price prediction consensus, which remains finely balanced between renewed upside and a sharp corrective phase.
