


- Trending
- Comments
- Latest
Bitcoin consolidated near $90,000 over the weekend despite $782 million in spot ETF outflows between Dec. 22-26, as technical indicators signal a potential breakout from a tightening symmetrical triangle pattern formed since mid-November.
The outflows extended December’s net exits to $1.08 billion and brought two-month institutional withdrawals to $4.56 billion, according to SoSoValue data, yet Bitcoin has held above key support levels as derivative markets show rising bullish positioning and geopolitical tensions drive safe-haven demand.
Last week’s decline followed a sharp reversal in spot ETF flows. After strong inflows throughout Q2 and Q3 helped propel Bitcoin to its October all time high of $126,080, the market has now faced sustained Bitcoin ETF outflow pressure.
This ongoing Bitcoin ETF outflow suggests institutional conviction remains fragile, likely keeping investor sentiment muted in the near term. Macro factors have added to the caution, as reduced expectations for Federal Reserve rate cuts in early 2026 continue to cap risk appetite.
Prediction market data from Polymarket shows the odds of a 25 basis point rate cut at just 13%, with an 87% probability of no change reinforcing the headwinds created by Bitcoin ETF outflow dynamics.
Despite these pressures, BTC briefly rebounded above $90,000 on Monday, Dec. 25, touching $90,200 before easing to around $89,830 at press time.
The rebound appears partly linked to renewed geopolitical tension between Russia and Ukraine which pushed oil prices higher and drove some capital into perceived safe haven assets like Bitcoin offsetting some of the drag from Bitcoin ETF outflow.
Derivative market activity has also provided short term support. Data from CoinGlass shows the Bitcoin weighted funding rate climbing to one of its highest levels since October indicating growing bullish bets among traders.
Bitcoin futures open interest has risen 7% over the past 24 hours suggesting fresh participation that could amplify price moves even as Bitcoin ETF outflow remains a background risk.
On the 4 hour chart, Bitcoin has been forming a symmetrical triangle since mid November. While typically a neutral pattern, a decisive break above the upper trendline often acts as a bullish trigger.
Currently, bulls hold a technical edge: the Aroon Up sits at 100% versus an Aroon Down reading of 7.14%, signaling dominant buying pressure. The MACD has also crossed above the zero line and continues to trend higher confirming strengthening bullish momentum.
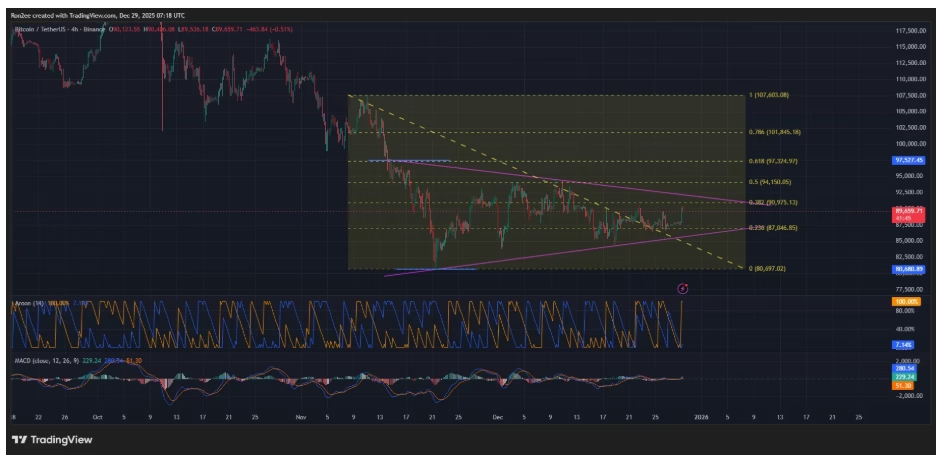
Traders are now watching the $90,975 level which aligns with the 38.2% Fibonacci retracement. A high volume breakout above this zone could validate the pattern and open the door to a move toward $94,200 a level last tested earlier this month.
However, failure to hold above $87,000 would invalidate the bullish setup and could expose Bitcoin to a pullback toward the $85,000 psychological support especially if Bitcoin ETF outflow accelerates again.

Copyright © 2025 - The Bit Gazette.

