


- Trending
- Comments
- Latest
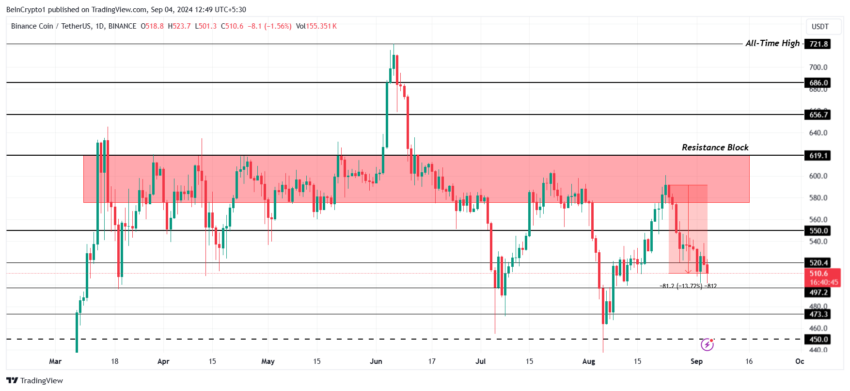
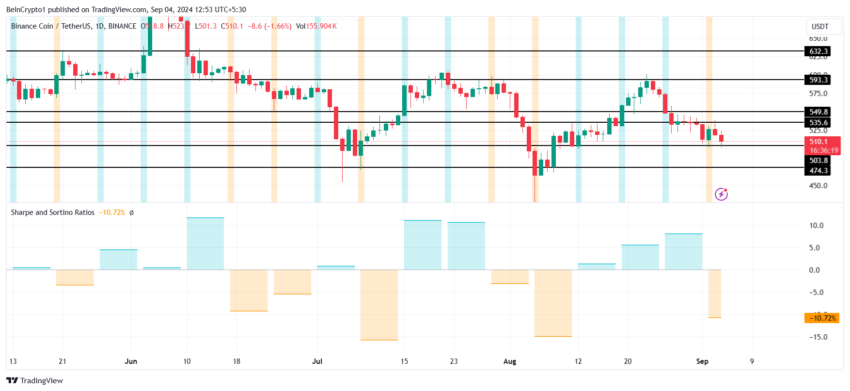
The BNB price analysis reveals that BNB’s recent 13% drop, following multiple failed attempts to convert the $520 resistance block into support, might not be as bearish as it seems. Instead, it could be a precursor to a robust recovery. Investors have witnessed similar scenarios in the past where BNB, after a significant drop, has bounced back stronger, challenging higher resistance levels.
The current situation mirrors those historical patterns, indicating that BNB could be on the verge of another upward move. This possibility is bolstered by the fact that the price range between $520 and $497 has often acted as a consolidation zone before a rally. If BNB follows this pattern, it could breach the $520 resistance once again, potentially paving the way for a rise above $550.
A critical factor in this BNB price analysis is the Sharpe Ratio, a key indicator used to assess the risk-adjusted return of an asset. For BNB, the Sharpe Ratio currently stands at -10.72%, which is typically seen as a signal of increased volatility and risk. However, negative Sharpe Ratios have historically been followed by periods of substantial gains.
Investors familiar with these patterns understand that a negative Sharpe Ratio often precedes a rebound. As such, BNB’s current Sharpe Ratio could be indicative of an impending recovery, offering an attractive entry point for investors looking to capitalize on the next upswing.
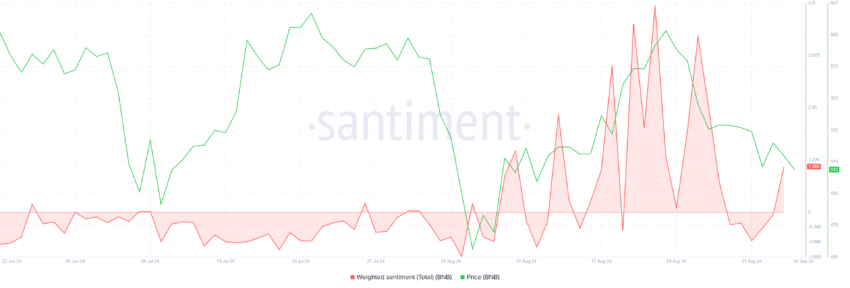
Another significant aspect of this BNB price analysis is the current market sentiment surrounding BNB. Despite the recent decline, on-chain metrics reveal a growing optimism among BNB holders.
This positive sentiment is crucial in the world of cryptocurrencies, where psychological factors can significantly influence price movements.
As sentiment turns more favorable, it could lead to increased buying pressure, which, in turn, supports a potential price rebound. According to market analysts, if this optimistic outlook continues to build, it could be the catalyst that propels BNB past its current resistance levels and into a new phase of growth.
Based on the current BNB price analysis, the outlook for BNB is cautiously optimistic. The price has been hovering around the $510 mark, but the consolidation zone between $520 and $497 suggests that a rally could be imminent. Should BNB manage to break through the $520 resistance, it could aim for a higher target range, with the next significant resistance block between $575 and $619.
Crypto market expert John Doe, a well-known analyst in the industry, shared his insights: “BNB’s price action is currently at a critical juncture. The recent drop, while concerning, is not unusual for BNB. If history is any guide, we could see a significant recovery soon, especially if the market sentiment continues to improve. Investors should keep a close eye on the $520 resistance level—breaking through that could signal the start of the next bull run for BNB.”
In addition to the technical factors, the broader market environment also plays a role. The cryptocurrency market has been experiencing increased volatility, but the overall sentiment remains bullish. As more investors look to capitalize on potential recovery plays, BNB could attract substantial attention, driving prices higher.
For those considering an investment in BNB, this BNB price analysis offers some critical takeaways. First, while the recent 13% drop might be unsettling, it’s essential to view it within the broader context of BNB’s price history. This type of volatility is not uncommon, and past performance suggests that BNB has the potential to recover and even exceed previous highs.
Second, the combination of a negative Sharpe Ratio and growing market optimism provides a unique opportunity for investors. Those who enter the market at this stage could benefit from the potential upside if BNB follows its historical patterns.
Finally, it’s crucial to monitor the key resistance levels closely. Breaking through the $520 mark would be a significant indicator that BNB is on track for a recovery. Investors should be prepared to act quickly if this threshold is crossed, as it could trigger a wave of buying that pushes the price higher.
In conclusion, this BNB price analysis suggests that while BNB has faced recent challenges, the potential for recovery is strong. The combination of historical trends, market sentiment, and key indicators like the Sharpe Ratio all point towards a possible rebound. Investors should remain vigilant, watching for critical price movements that could signal the start of BNB’s next rally. The Bit Gazette has the latest crypto news and expert analysis

Copyright © 2025 - The Bit Gazette.

