


- Trending
- Comments
- Latest
Solana-focused exchange-traded funds recorded their first net outflows in four weeks as the token dropped toward the $130 level, marking a sharp reversal in institutional sentiment after a month of steady capital inflows.
The pullback in ETF flows coincided with SOL breaking down from a technical pattern that projects further downside, while on-chain data shows holders have recorded net realized losses for four consecutive days, according to blockchain analytics firm Glassnode.
For nearly a month, Solana etf inflow data had painted a picture of cautious optimism. Capital consistently flowed into SOL-linked products as investors anticipated a recovery from December’s weakness. That narrative unraveled when Solana failed to sustain upside momentum, confirming a downside technical break.
According to market data, Solana spot ETFs saw net outflows for the first time since early December 2025. The previous outflow event occurred on December 3, making the latest reversal especially significant for funds that typically reflect longer-term positioning rather than short-term trading.
“ETF flows are often a window into institutional conviction,” said James Butterfill, head of research at CoinShares. “When Solana etf inflow trends reverse after a sustained period, it usually signals deeper concerns about price durability.”
The pullback in Solana etf inflow suggests macro-focused investors are shifting to risk-off positioning. Unlike retail traders, ETF participants tend to respond to structural signals—such as failed breakouts and weakening momentum—rather than intraday volatility.
Solana’s inability to reclaim key resistance levels reduced confidence that the rally could continue. As price stalled, capital rotated out of SOL-linked funds, adding pressure to an already fragile market structure.
This reversal also underscores the reflexive relationship between price and flows. When Solana etf inflow slows or turns negative, it removes a stabilizing source of demand, leaving spot markets more exposed to sell-side pressure.
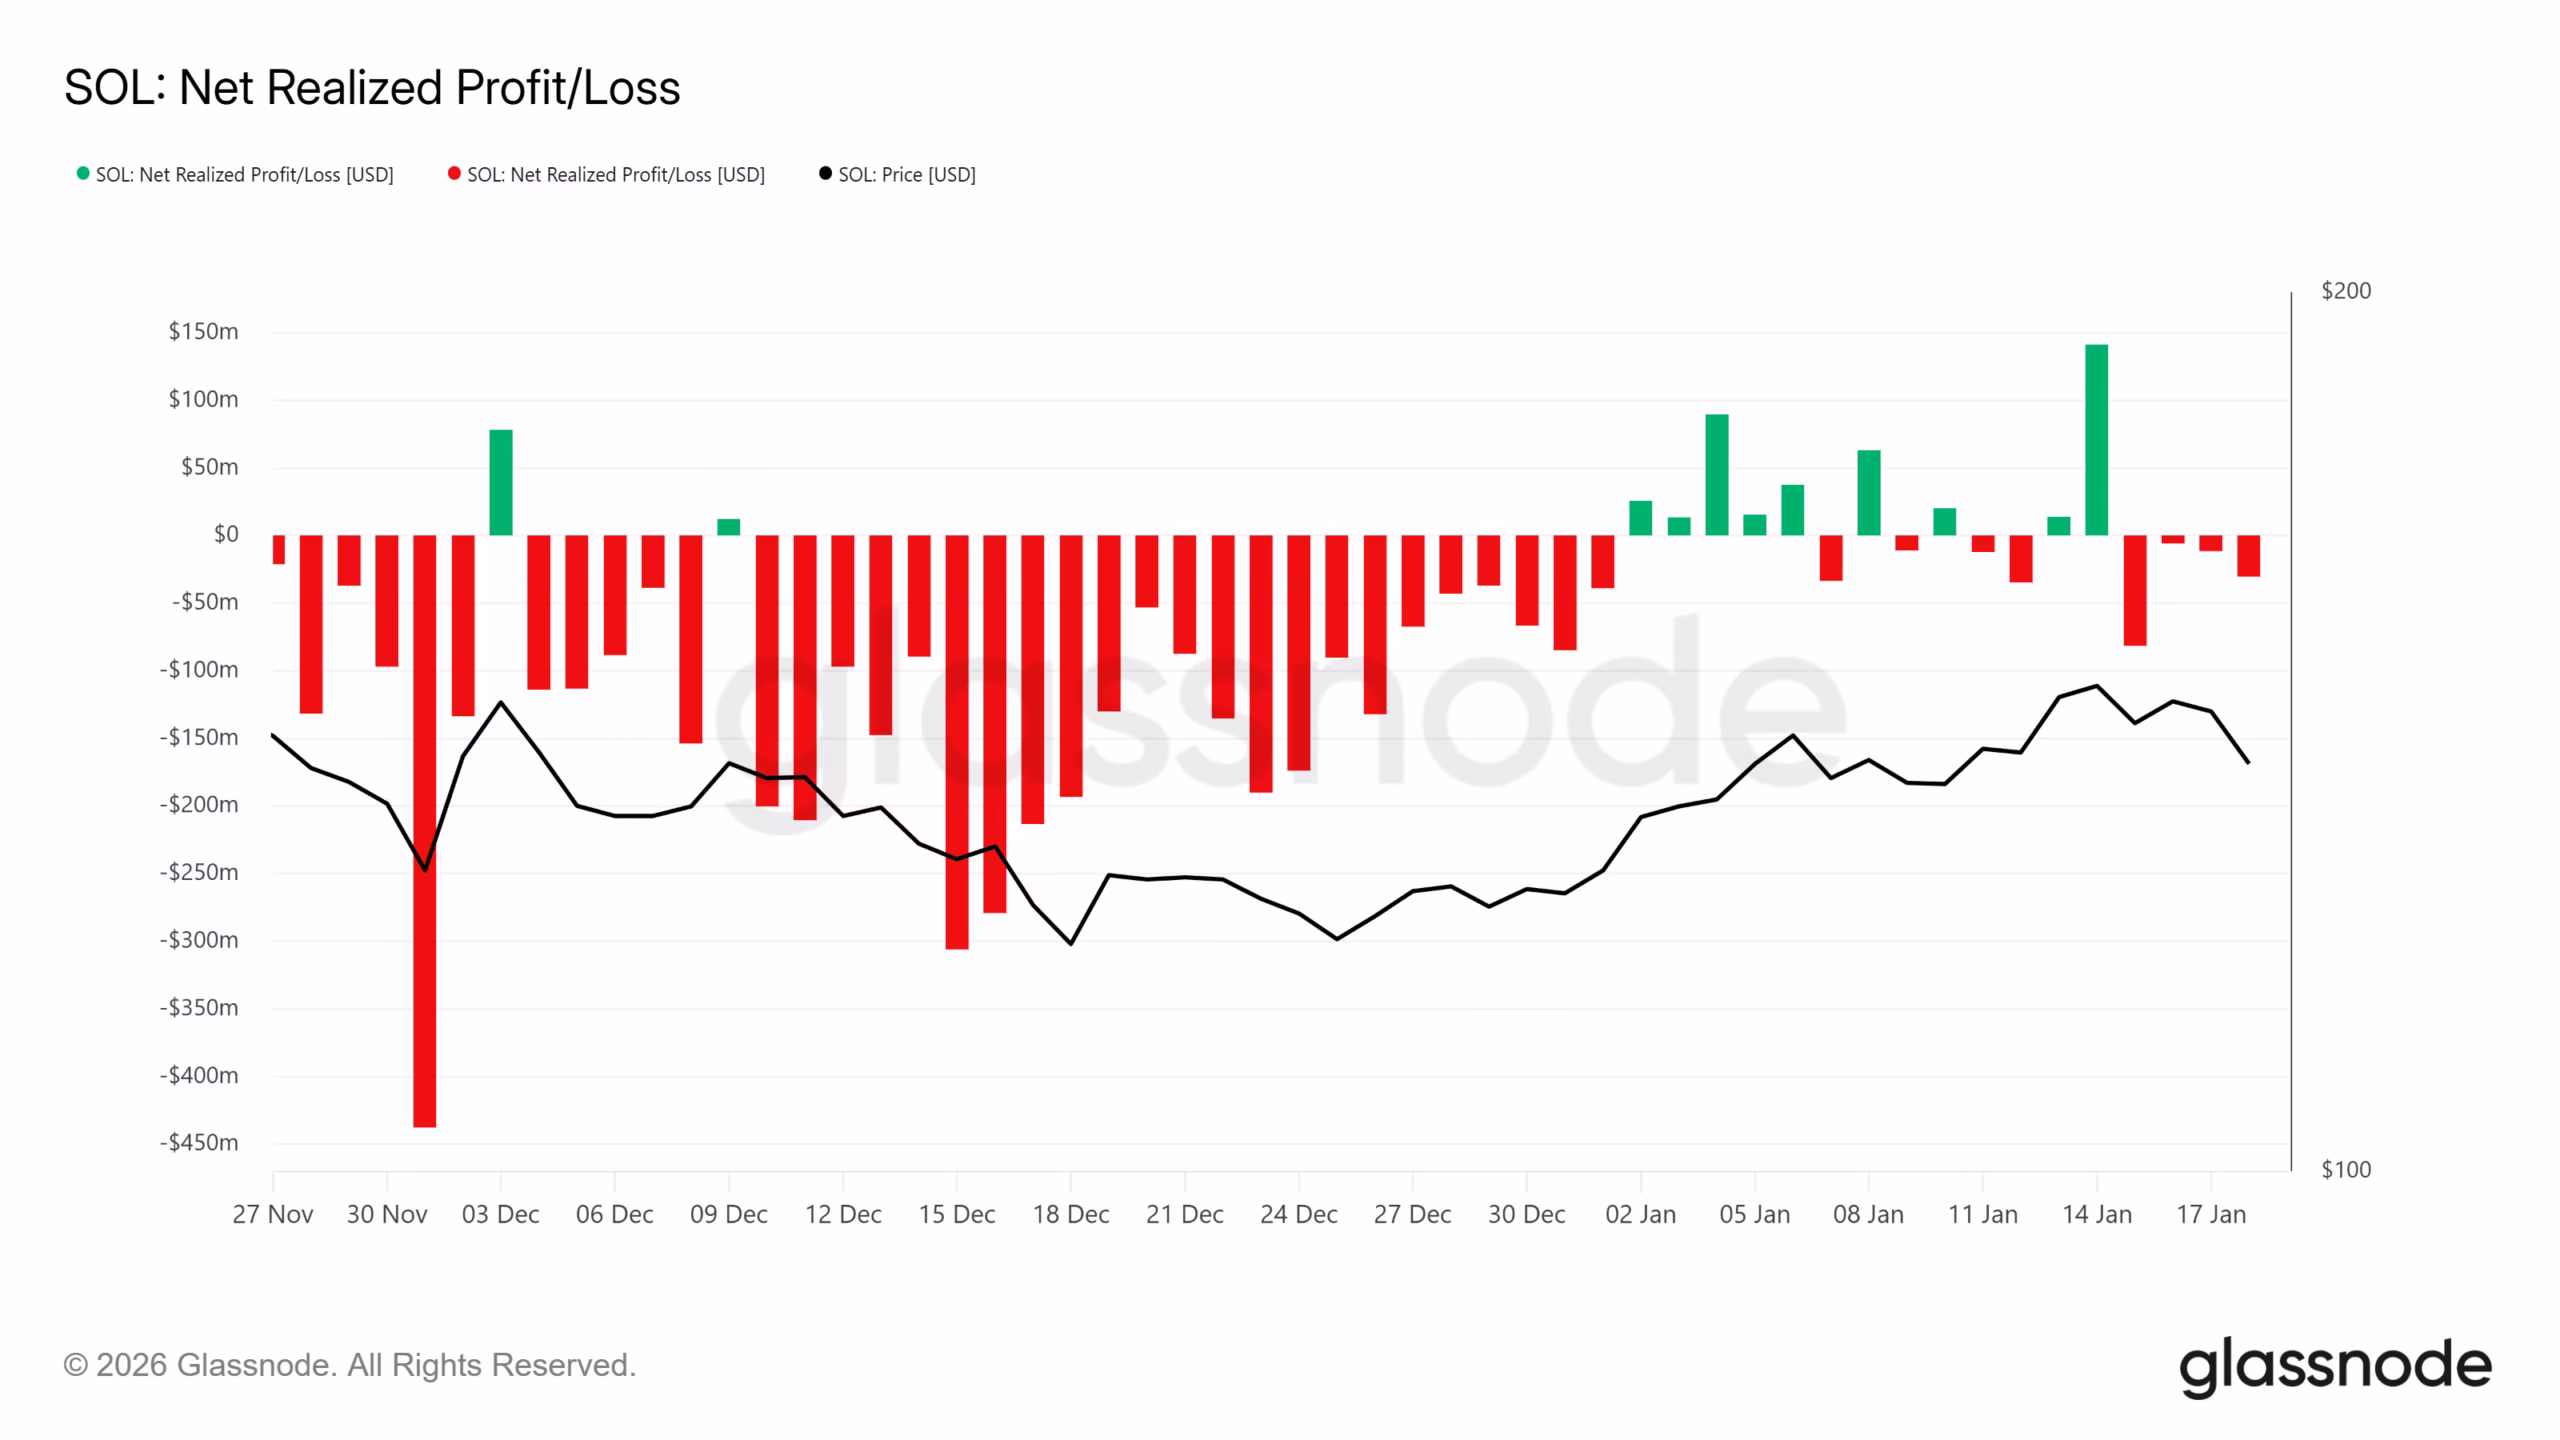
Blockchain data reinforces the cautious outlook following the Solana etf inflow reversal. Net Realized Profit/Loss metrics show holders have logged net losses for four consecutive days, indicating that recent buyers are now underwater.
Historically, extended periods of realized losses increase the likelihood of distribution, particularly when confidence deteriorates. Analysts note that realized losses dominated Solana throughout December 2025, reflecting persistent downside pressure.
January briefly offered relief, with improving profitability suggesting sellers were exhausted. That optimism faded quickly as renewed selling erased gains, coinciding with the downturn in Solana etf inflow metrics.
“Once panic selling begins, ETF investors often step back first,” said Alex Thorn, head of research at Galaxy Digital. “That’s exactly what we’re seeing with Solana etf inflow dynamics right now.”
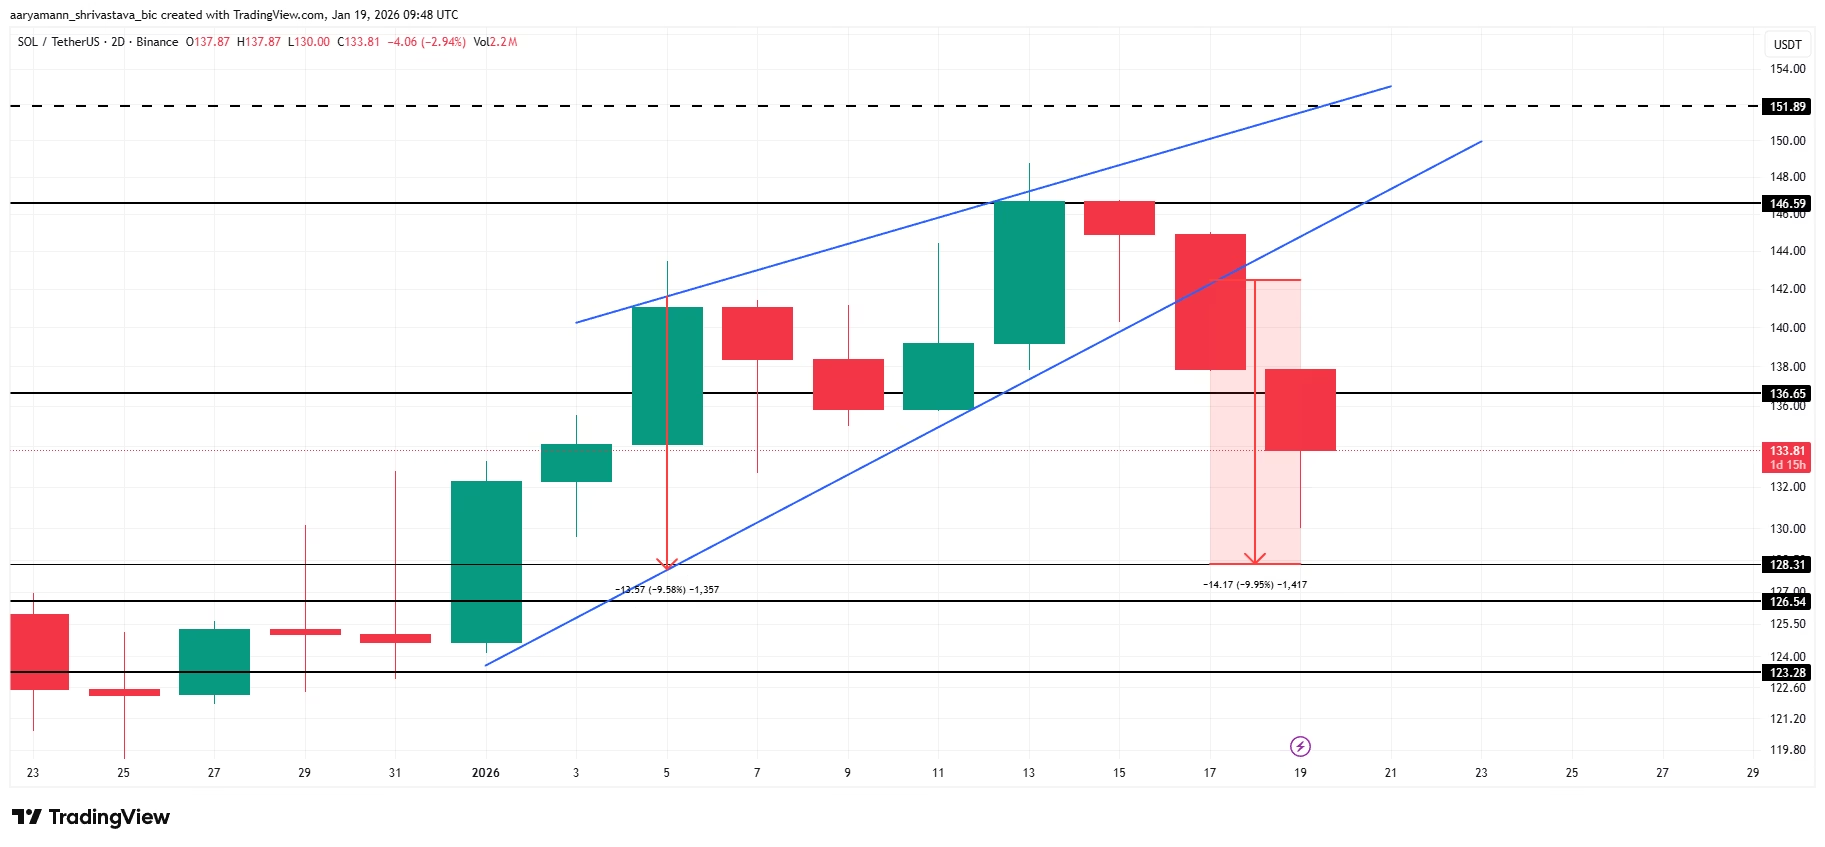
From a technical perspective, Solana has broken down from an ascending wedge pattern—traditionally a bearish formation. The structure projected a downside move of roughly 10%, targeting the $128 region.
SOL recently touched an intraday low near $130, validating the pattern and reinforcing concerns tied to weakening Solana etf inflow data. With momentum indicators trending lower, the path of least resistance remains to the downside.
ETF outflows, combined with rising realized losses, form a feedback loop that weighs on price stability. Each leg lower increases stress on holders, which in turn discourages renewed Solana etf inflow support.
Despite the bearish setup, analysts say the outlook is not irreversible. A stabilization—or recovery—in Solana etf inflow would be the first signal that institutional confidence is returning.
If selling pressure eases and SOL reclaims $136 as support, the current bearish thesis would weaken. Holding that level could open the door to a move toward $146, restoring short-term bullish momentum and encouraging renewed Solana etf inflow activity.

However, failure to defend the $128–$130 zone may trigger additional ETF redemptions, deepening losses and extending the corrective phase.
The current episode highlights how closely price action and Solana etf inflow trends are intertwined. After weeks of steady accumulation, the sudden reversal underscores how quickly institutional sentiment can shift when technical expectations break down.
For now, Solana remains in a vulnerable position. Investors will be watching closely to see whether Solana etf inflow stabilizes—or whether continued outflows confirm a broader re-rating of SOL risk in institutional portfolios.
As markets digest the failed recovery attempt, the next few trading sessions may determine whether this pullback is a temporary shakeout or the start of a deeper correction driven by fading Solana etf inflow confidence.

Copyright © 2025 - The Bit Gazette.

