


- Trending
- Comments
- Latest

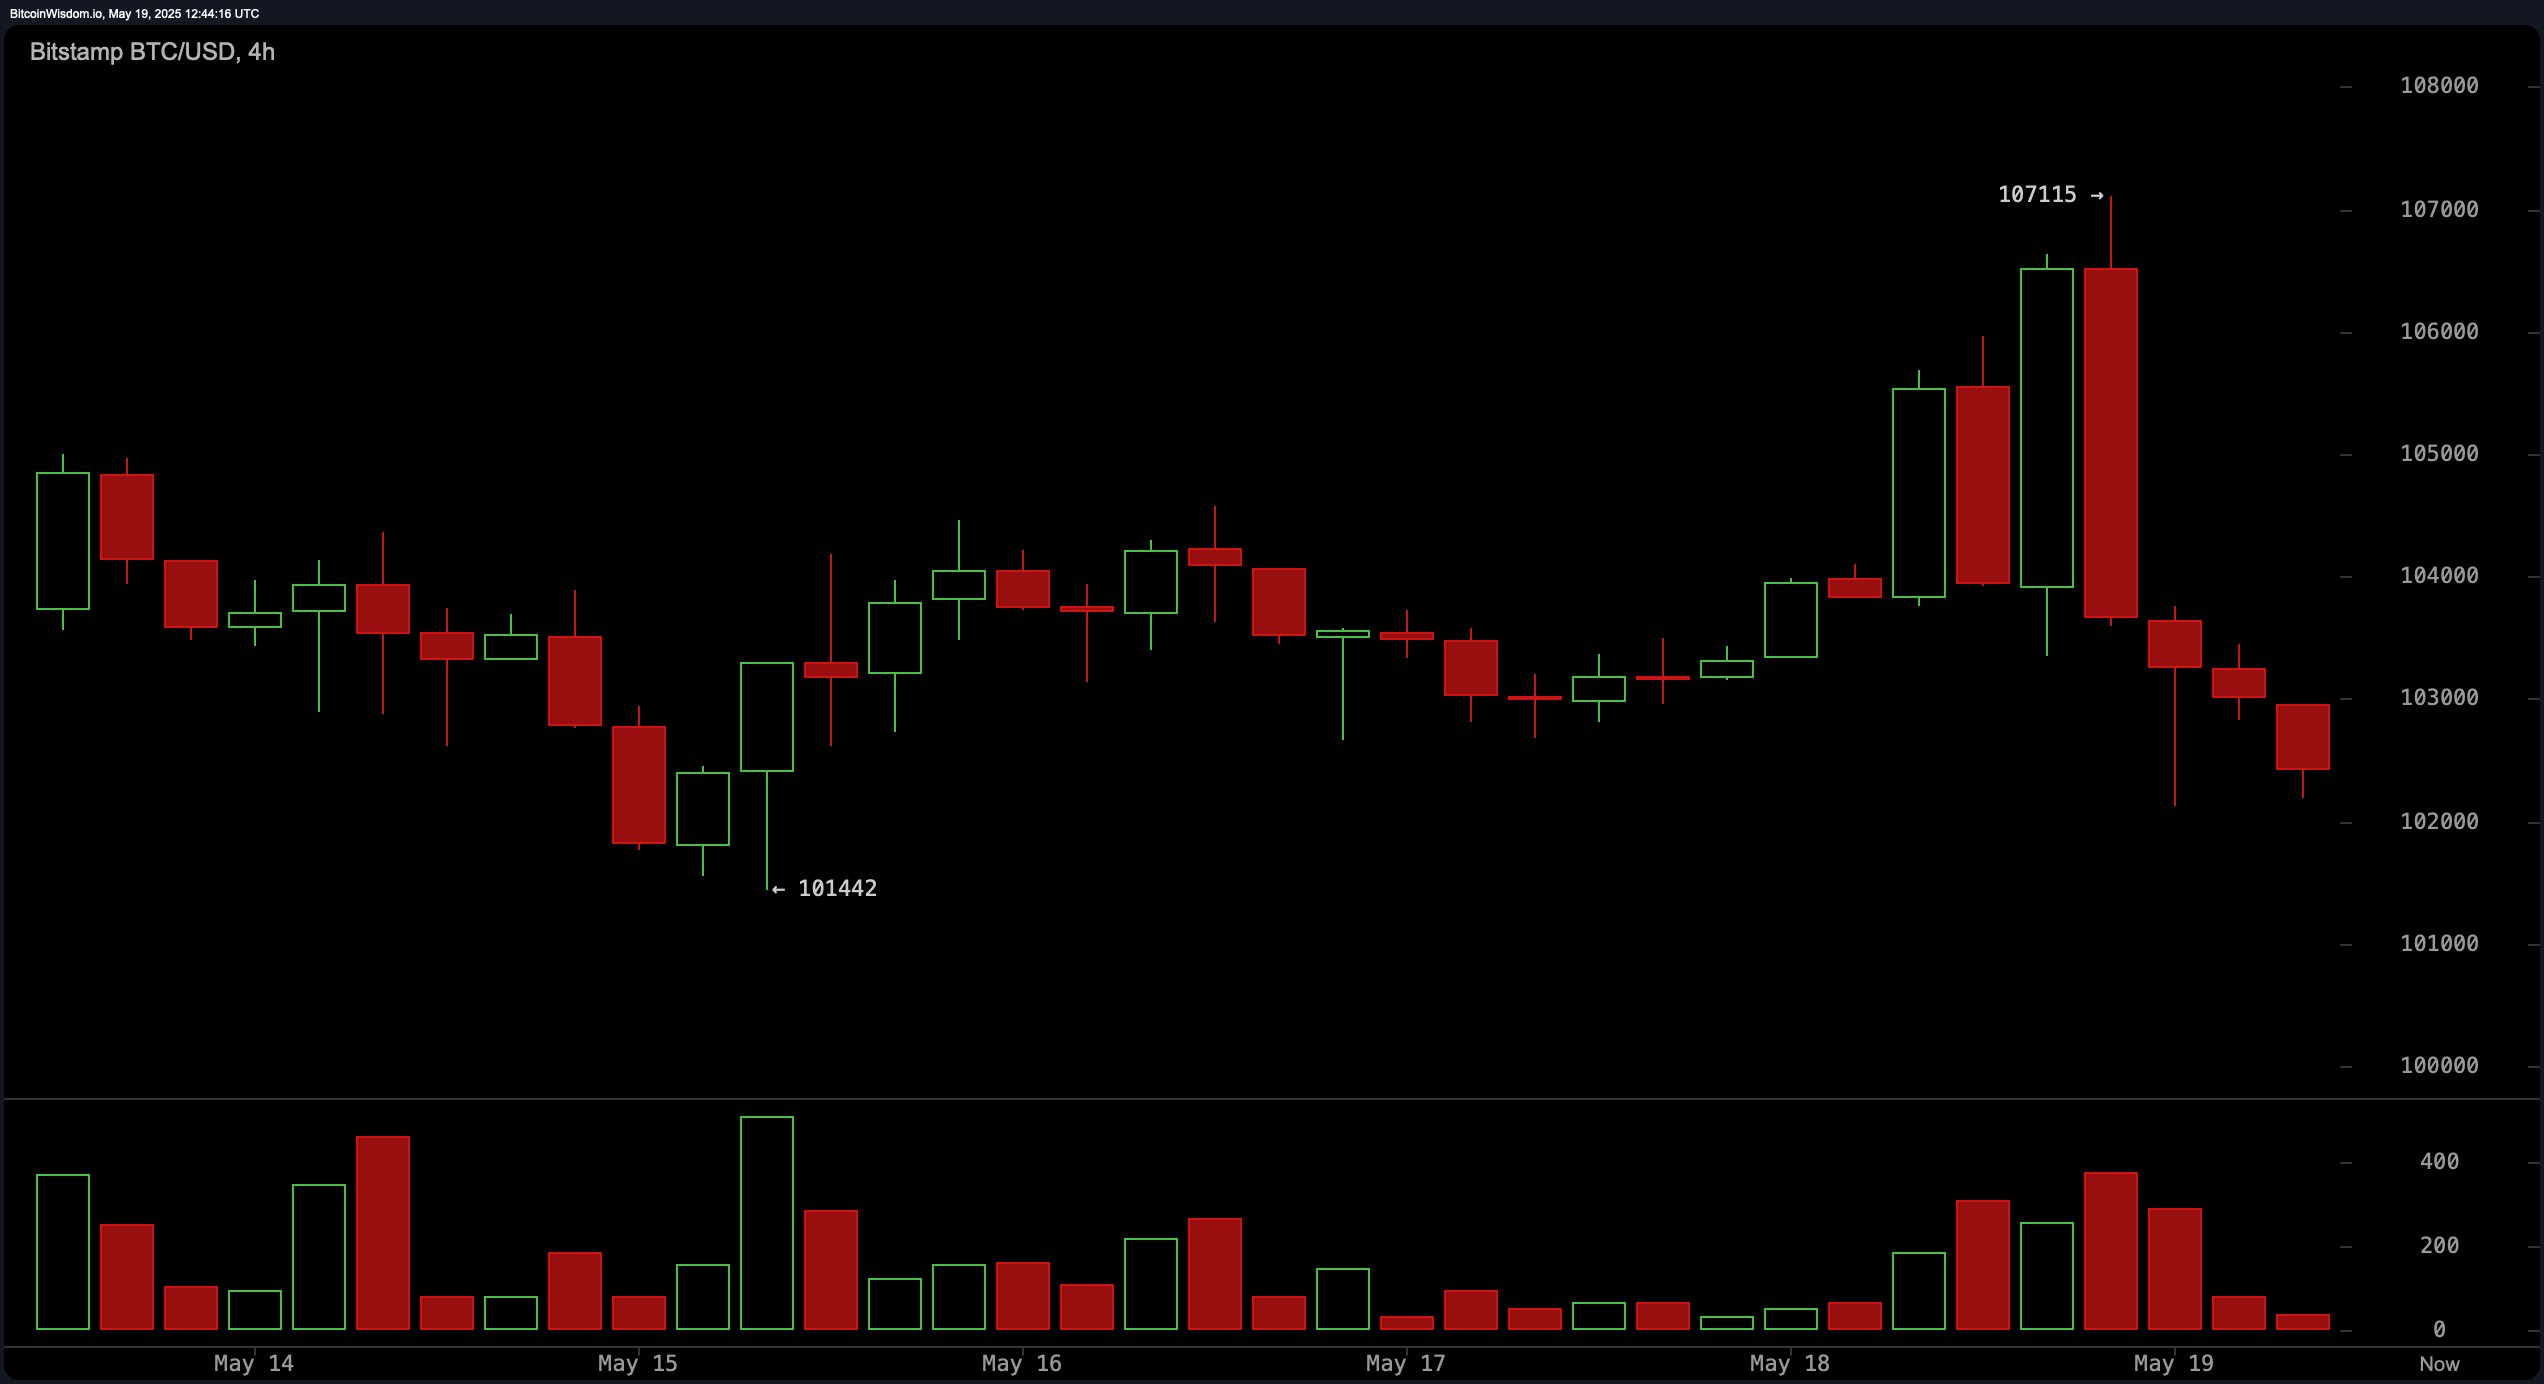
Bitcoin’s rally to a record high of $107,115 has hit a snag, with the cryptocurrency now trading at $102,554 amid heightened volatility.
The Bitcoin price update reveals a sharp 4.3% drop from its peak, sparking debates among traders on whether this is a healthy correction or the start of a deeper pullback.
Market data shows Bitcoin’s 24-hour trading volume surged to $47.58 billion, while its market cap stands at $2.03 trillion.
The intraday swing between $102 and $107,115 has left investors cautious, with technical indicators hinting at further downside risk.
The daily chart shows a potential bearish engulfing pattern, signaling exhaustion after bitcoin’s meteoric rise from $107,000. Analysts note that heavy volume accompanied the sell-off, reinforcing the bearish sentiment.
“The rejection at 107K was brutal,” says Michae¨lvande Poppe, a prominent cryptoanalyst. 101,500, we could see a deeper correction toward $95K before the next leg up.”
The Bitcoin price update on the 4-hour chart reveals shrinking candle bodies after the initial drop—a sign that selling pressure may be easing. However, failure to hold $102,000 could trigger another wave of liquidations.
Short-term momentum remains weak, with Bitcoin struggling to reclaim $103,000. The Bitcoin price update on the 1-hour chart shows a clear lower highs and lower lows pattern, suggesting bears are in control for now.
“This is a classic bull market correction,” argues Lark Davis, a crypto investor. “Bitcoin has seen 20-30% pullbacks in past cycles before resuming its uptrend. The key is to watch where buyers step in.”
Oscillator readings add to the uncertainty:
RSI at 59 (neutral but leaning bearish)
Stochastic at 81 (sell signal)
MACD in negative territory (bearish bias)
Meanwhile, moving averages paint a conflicting picture—short-term EMAs signal sell, while longer-term averages (50-day, 200-day) remain in buy territory.
Despite the pullback, on-chain data reveals strong accumulation by whales. CryptoQuant reports a spike in BTC withdrawals from exchanges, suggesting long-term holders aren’t panicking.
“Institutions are still buying the dip,” notes Will Clemente, lead analyst at Blockware Solutions. “The macro setup for bitcoin hasn’t changed—ETF inflows and halving scarcity are still in play.”
The Bitcoin price update coincides with growing spot ETF demand, with BlackRock’s IBIT seeing $1.2 billion in inflows this week. This institutional support could cushion further downside.
Holds $101,500 support
Rebounds above $103,000 with volume
Retests $107K resistance
Breaks $101,000 decisively
Targets $95,000 support zone
Prolonged consolidation phase
The Bitcoin price update will hinge heavily on macroeconomic factors, including Fed rate decisions and geopolitical risks. For now, traders are advised to monitor $102K as a critical inflection point.
“Bitcoin doesn’t go up in a straight line,” reminds PlanB, creator of the Stock-to-Flow model. “This is normal volatility—stay focused on the long-term trend.”
The latest Bitcoin price update leaves us with a critical question: Is this pullback a temporary pause in an unstoppable bull run, or the first crack in a speculative bubble?
History offers clues. Bitcoin has weathered countless corrections—some brutal, some brief—only to emerge stronger. The 2021 cycle saw 30%+ dips before new all-time highs. The 2024 halving’s supply shock is still unfolding. Institutions are piling in. Yet, markets never move in a straight line.
Perhaps the real lesson isn’t in the charts but in psychology. Fear and greed move faster than fundamentals. When prices drop, the weak hands sell, while the patient accumulates. As legendary trader Peter Brandt once said, “The market’s job is to inflict maximum pain on the maximum number of participants.”

Copyright © 2025 - The Bit Gazette.

