


- Trending
- Comments
- Latest

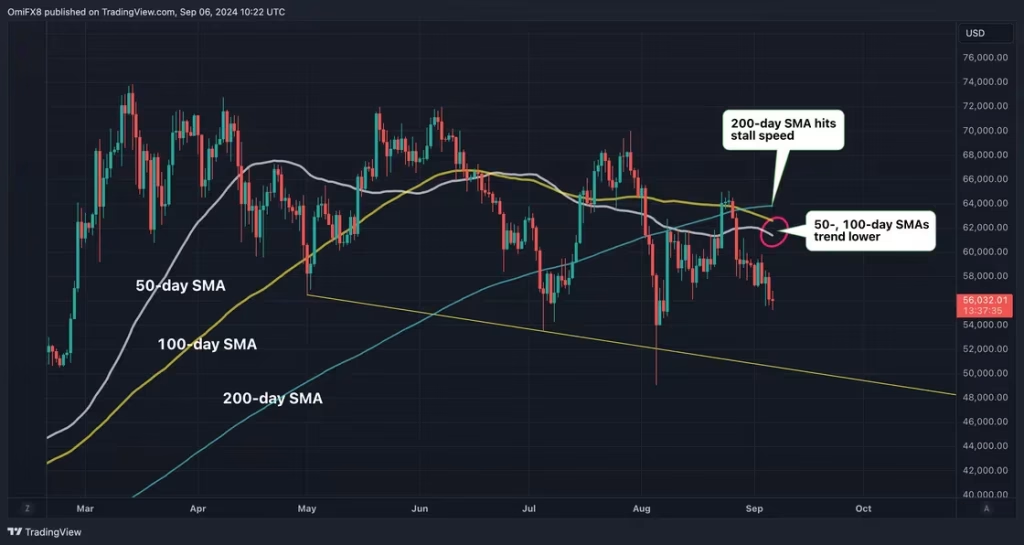
Bitcoin’s 200-day average is at a critical juncture as its long-standing bullish momentum might be about to falter. For the first time since October, Bitcoin’s 200-day simple moving average (SMA)—a widely respected indicator of the cryptocurrency’s long-term trend—appears to be stalling. This development comes at a time when the entire market is on edge, with upcoming U.S. jobs data expected to influence the Federal Reserve’s monetary policy.
The Bitcoin’s 200-Day Average is a crucial metric that traders and investors alike use to gauge the overall health and direction of the cryptocurrency market. As of late August, the average daily increase in Bitcoin’s 200-day SMA has been a mere $50, a stark contrast to the $200-plus moves observed earlier in the year, according to data from TradingView. With Bitcoin’s spot price recently hovering around $55,880, the 200-day SMA now stands at $63,840, reflecting a clear slowdown.
The Bitcoin’s 200-Day Average is not just a number—it’s a psychological benchmark for market participants. When Bitcoin trades above this average, it is generally considered to be in a long-term uptrend. Conversely, trading below this level often signals a bearish phase. The recent slowdown in the 200-day SMA suggests that Bitcoin may be losing its bullish momentum, a development that could have significant implications for the broader market.
Alex Kuptsikevich, a senior market analyst at The FxPro, pointed out the heightened uncertainty in the financial markets, which is affecting Bitcoin’s performance. “Despite the dollar’s weakness, the financial markets are still in an anxious and expectant mood, which is not helping Bitcoin as much as it is helping gold,” Kuptsikevich said in an email to CoinDesk. “A critical technical support level for the BTCUSD remains just above $54,000, but slippage in the event of a volatility spike could see the price briefly drop below $53,000.”

Adding to the concern is the recent bearish crossover, where the 100-day SMA has dipped below the 200-day SMA. This crossover, often seen as a precursor to further declines, confirms the weakening bullish sentiment. Bitcoin’s 200-Day Average has reached a stall speed that signals potential trouble ahead.
Market observers are keeping a close eye on Bitcoin’s price levels. Arthur Hayes, co-founder and former CEO of BitMEX, recently expressed his bearish outlook. “BTC is heavy, I’m gunning for sub $50k this weekend. I took a cheeky short. Pray for my soul, for I am a degen,” Hayes posted on X, reflecting the cautious mood among traders.
The global economic environment is another factor contributing to the cautious sentiment surrounding Bitcoin. The upcoming U.S. nonfarm payrolls report (NFP) for August is expected to be a significant market mover. According to FXStreet, economists are predicting a 160,000 rise in jobs, down from July’s 114,000 increase. The unemployment rate is expected to decline slightly to 4.2%, which would mark a drop from July’s near three-year high.
A weaker-than-expected NFP report could stoke fears of a recession and increase the likelihood of the Federal Reserve implementing a 50 basis point interest-rate cut later this month. This could, in turn, put a temporary floor under risk assets, including Bitcoin. However, traders should be wary of a repeat of August’s market dynamics, where a growth scare led to significant volatility in both stocks and cryptocurrencies.
The potential decline of Bitcoin’s 200-Day Average could be a turning point for the market. Historically, when the 200-day SMA begins to flatten or decline, it often precedes a period of heightened volatility. Given the current macroeconomic backdrop, this could mean more downside for Bitcoin in the short term.
However, it’s important to note that the final flush lower in Bitcoin’s price could also set the stage for a larger rally, as suggested by the LondonCryptoClub newsletter. “Looks pretty ugly out there right now, [with the] market rapidly pricing global recession risks,” the newsletter stated. Still, the final flush lower in BTC could set the stage for a bigger rally.
From a technical perspective, Bitcoin’s daily chart shows major support around the $50,000 mark. This level is characterized by a trendline that connects the corrective lows reached in May and July, making it a crucial level to watch. If Bitcoin were to break below this support, it could lead to a further decline, potentially bringing the price down to the mid-$40,000 range.
On the other hand, if Bitcoin manages to hold above this level, it could signal that the market is preparing for another leg up. In either scenario, Bitcoin’s 200-Day Average will play a pivotal role in shaping market sentiment.
As we move forward, the Federal Reserve’s monetary policy decisions will likely have a significant impact on Bitcoin’s 200-Day Average. A more dovish stance from the Fed could provide some relief for risk assets, while a more hawkish approach could exacerbate the bearish trend.
In conclusion, Bitcoin’s 200-Day Average is at a crossroads. The coming days and weeks will be critical in determining whether this key metric will continue to signal long-term bullish momentum or if it will usher in a new bearish phase. Traders and investors should keep a close eye on the upcoming U.S. jobs data and the Federal Reserve’s response, as these will likely be the catalysts that determine the next major move in the cryptocurrency market. Get more from The Bit Gazette

Copyright © 2025 - The Bit Gazette.

